A quality engineer at an automotive parts plant monitors the variation in the lengths of camshafts. Three machines manufacture camshafts for three shifts each day. The engineer measures five camshafts from each machine during each shift.
The quality engineer creates a R chart to monitor the variation in each machine.
- Open the sample data, CamshaftLength.MWX.
- Choose .
- From the drop-down list, select All observations for a chart are in one column, enter Machine 1Machine 2Machine 3.
- In Subgroup sizes, enter Subgroup ID.
- Click R Options.
- On the Tests tab, select 1 point > K standard deviations from center line (Test 1) and K points in a row on same side of center line (Test 2).If you are not sure which tests apply in your specific situation, use Tests 1 and 2.
- Click OK in each dialog box.
Interpret the results
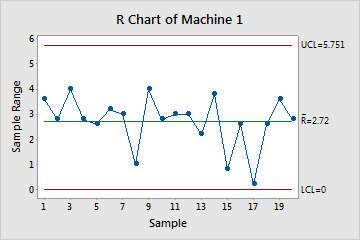
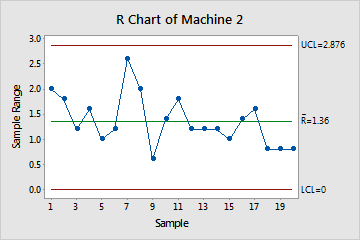
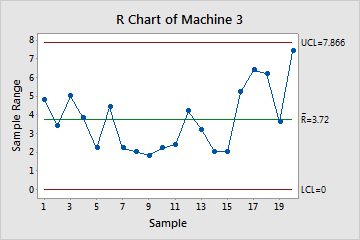
Minitab creates three R charts, one chart for each machine. None of the points are outside the control limits and the points display a random pattern for all 3 machines. Thus, the process variation is in control, and the engineer can examine the process center on the Xbar charts.