Quality engineers at a company that manufactures floor tiles investigate customer complaints about warping in the tiles. To ensure production quality, the engineers measure warping in 10 tiles each working day for 10 days. The upper specification limit for the warping measurement is 6 mm. The engineers know that the distribution of warping follows the Weibull distribution.
The engineers perform nonnormal capability sixpack to check the assumptions for nonnormal capability analysis and to evaluate how well the tile manufacturing process meets customer requirements.
- Open the sample data, TileWarping.MWX.
- Choose .
- In Single column, enter Warping.
- In Subgroup size, enter 10.
- From Fit distribution, select Weibull.
- In Upper spec, enter 8.
- Click OK.
Interpret the results
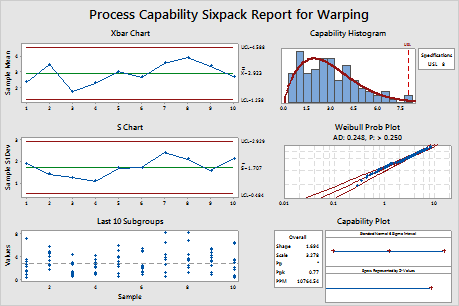
The Xbar and S charts indicate that the process is stable, with no points beyond the control limits. The Last 10 subgroups chart indicates there are no apparent outliers and the distribution does not appear to change. The Weibull probability plot indicates that the Weibull distribution is a good fit for the data. Therefore, the assumptions for nonnormal capability analysis are satisfied and the capability of the process can be analyzed.
The process data appear to follow the fitted curve of the Weibull distribution. However, the capability plot shows that the process is not meeting specifications. The expected overall Ppk is 0.77, which is less than the generally accepted industry guideline of 1.33. Therefore, the engineers conclude that the process is not capable and does not meet customer requirements.