About missing groups and empty cells
In the following worksheet, the two grouping variables Style and Size each have three values. However, some data are missing.
| C1-T | C2-T | C3 |
|---|---|---|
| Style | Size | Quantity |
| Short | Small | 4 |
| Short | Medium | 6 |
| Short | Large | 3 |
| Long | Small | 3 |
| Long | Medium | 7 |
| Long | Large | 2 |
| Small | 5 | |
| Hooded | Small | 1 |
| Hooded | Medium | 4 |
- Missing group
- One row contains a missing value in the Style column with Small in the Size column. This set of data is considered a "missing group".
- Empty cell
- The group Hooded/Large does not appear here. This combination is considered an "empty cell". You can exclude empty cells to save space on your graph, or to show that the group does not exist.
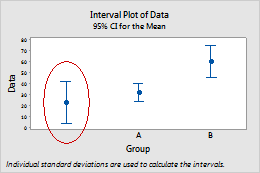
Include missing group name data
| C1-T | C2 |
|---|---|
| Group | Data |
| A | 22 |
| 30 | |
| B | 47 |
| 25 | |
| ... | ... |
- Click Data Options.
- On the Group Options tab, deselect Include missing as a group.
Include empty data cells
| C1-T | C2 | C3 |
|---|---|---|
| Group | Subgroup | Data |
| A | 1 | 55 |
| B | 1 | 41 |
| B | 2 | 29 |
| C | 1 | 44 |
| C | 2 | 33 |
- Click Data Options.
- On the Group Options tab, deselect Include empty cells.
- Double-click the graph.
- Double-click the scale to open the Edit Scale dialog box.
- On the Scale tab, deselect Include empty cells.
Examples of including or excluding missing groups and empty cells
The following examples graph data from the previous worksheet to show all possible combinations.
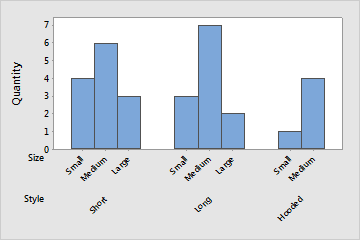
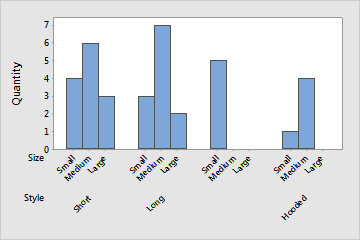
Do not include missing as a group, do not include empty cells
If you deselect both Include missing as a group and Include empty cells, Minitab excludes the group Hooded/Large and the group created by a missing value and Small.
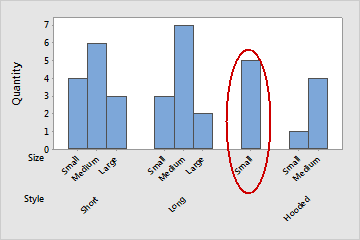
Include missing as a group, do not include empty cells
If you select only Include missing as a group, Minitab includes a bar for the "missing group" formed by an empty cell and the value Small.
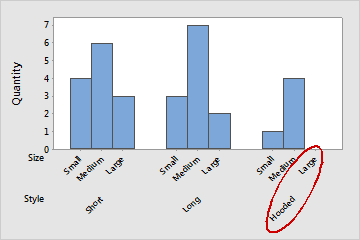
Do not include missing as a group, include empty cells
If you select Include empty cells, Minitab includes an empty placeholder for the group Hooded/Large.
Include missing as a group, include empty cells
If you check both Include missing as a group and Include empty cells (the defaults), Minitab includes both empty cell and missing groups from the earlier examples, as well as the empty cells created by their combination (a missing value with "Medium" and a missing value with "Large"). When used in the context of paneling, these options have a similar effect on the number of panels.