Complete the following steps to specify the data for your graph.
- In Graph variables, enter multiple columns that you want to graph.
- Select Stack dots of graph variables.
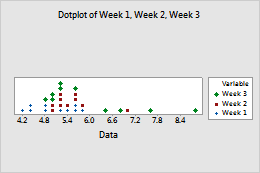
This worksheet contains the diameters of pipes produced each week for three weeks. Week 1, Week 2, and Week 3 are the graph variables. The graph shows the distribution of pipe diameters for each week. Each variable is represented by a different color and symbol.
| C1 | C2 | C3 |
|---|---|---|
| Week 1 | Week 2 | Week 3 |
| 5.10 | 5.57 | 8.73 |
| 5.53 | 5.11 | 5.01 |
| 4.78 | 5.76 | 7.59 |
| ... | ... | ... |