Use Bubble Plot to explore the relationships among three variables on a single plot. Like a scatterplot, a bubble plot plots a y-variable versus an x-variable. However, the symbols (also called bubbles) on the bubble plot vary in size. The area of each bubble represents the value of a third variable.
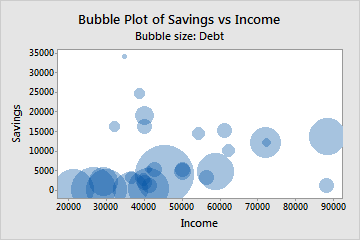
For example, a bank administrator creates a bubble plot to examine the relationship between income, savings, and debt for a group of loan applicants.
Where to find this graph
To create a bubble plot, choose .