The normal distribution is a bell-shaped distribution where successive standard deviations from the mean establish benchmarks for estimating the percentage of data observations. These benchmarks are the basis behind many hypothesis tests such as Z- and t-tests.
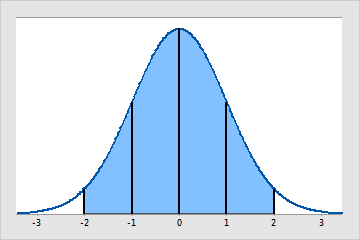
Histogram of a hypothetical normal distribution
- About 95% of the observations fall within 2 standard deviations of the mean, shown by the blue shaded area. 95% of the values will be within 1.96 standard deviations of the mean (between −1.96 and +1.96). Thus, less than 5% (0.05) of the observations will be outside this range. This range is the basis behind the 0.05 alpha level for many hypothesis tests.
- About 68% of the observations fall within 1 standard deviation from the mean (-1 to +1), and about 99.7% of the observations would fall within 3 standard deviations of the mean (-3 to +3).
Example of a normal distribution
The heights of all adult males residing in the state of Pennsylvania are approximately normally distributed. Therefore, the heights of most men will be close to the mean height of 69 inches. A similar number of men will be slightly taller and slightly shorter than 69 inches. Only a few will be much taller or much shorter. The standard deviation is 2.5 inches.
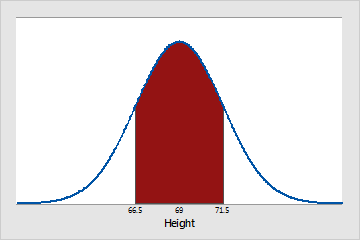
Approximately 68% of Pennsylvania men are between 66.5 (μ - 1σ) and 71.5 (μ + 1σ) inches tall.
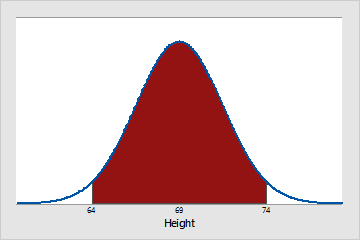
Approximately 95% of Pennsylvania men are between 64 (μ - 2σ) and 74 (μ + 2σ) inches tall.
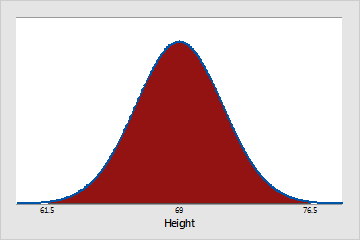
Approximately 99.7% of Pennsylvania men are between 61.5 (μ - 3σ) and 76.5 (μ + 3σ) inches tall.