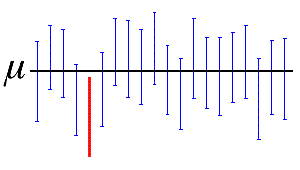
The confidence level represents the percentage of intervals that would include the population parameter if you took samples from the same population again and again. A confidence level of 95% usually works well. This indicates that if you collected one hundred samples, and made one hundred 95% confidence intervals, you would expect approximately 95 of the intervals to contain the population parameter, such as the mean of the population, as shown in the following figure.

Here, the horizontal black line represents the fixed value of the unknown population mean, µ. The vertical blue confidence intervals that overlap the horizontal line contain the value of the population mean. The red confidence interval that is completely below the horizontal line does not. A 95% confidence level indicates that 19 out of 20 samples (95%) from the same population will produce confidence intervals that contain the population parameter.
