In This Topic
Statistics
| Term | Description |
|---|---|
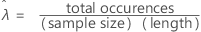
| rate of occurrence |
 |
| mean occurrence |
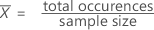 |
The rate equals the average number of occurrences per unit length of observation. The mean is the average number of occurrences in the entire sample. If length equals 1, then rate and mean are equal.
P-value for exact test
Formula
- H1: λ > λ0: p-value = P(S ≥ s | λ = λ0) where S has a Poisson distribution with mean nλ0t.
- H1: λ < λ0: p-value = P(S ≤ s | λ = λ0) where S has a Poisson distribution with mean nλ0t.
- H1: λ ≠ λ0: Minitab uses a likelihood ratio test as follows:
Define the function G(s), which expresses the likelihood ratio test in terms of s, the total number of occurrences in the Poisson process:

- if 0 ≤ s < nλ0t, solve the equation G(y) = G(s) for y in the interval (nλ0t, enλ0t];
p-value = P(S ≤ s | λ = λ0) + P(S ≥ y | λ = λ0)
- if s = nλ0t, then
p-value = 1.00
- if nλ0t < s ≤ enλ0t, solve the equation G(y) = G(s) for y in the interval [0, nλ0t);
p-value = P(S ≤ y | λ = λ0) + P(S ≥ s | λ = λ0)
- if s > enλ0t, the test is one-sided, and
p-value = P(S ≥ s | λ = λ0)
where S has a Poisson distribution with mean nλ0t.
- if 0 ≤ s < nλ0t, solve the equation G(y) = G(s) for y in the interval (nλ0t, enλ0t];
Notation
| Term | Description |
|---|---|
| s | total number of occurrences in the Poisson process |
| t | "length" of observation |
| λ0 | hypothesized value of the population rate paramter |
| λ | true value of the population rate parameter |
| n | sample size |
| e | 2.71828, approximately |
Confidence intervals and confidence bounds for exact test
Confidence intervals
An exact 100(1 – α)% confidence interval for the occurrence rate of a Poisson process is given by:


Confidence bounds
When you specify a one-sided test, Minitab calculates a one-sided 100(1 – α)% confidence bound, according to the direction of the alternative hypothesis.
-
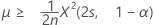
If you specify a "greater than" alternative hypothesis, the exact 100(1 – α)% lower bound of the rate is given by:

The exact 100(1 – α)% lower bound of the mean is given by:
-
If you specify a "less than" alternative hypothesis, the exact 100(1 – α)% upper bound of the rate is given by:

The exact 100(1 – α)% upper bound of the mean is given by:

Notation
| Term | Description |
|---|---|
| s | total number of occurrences in the Poisson process |
| t | "length" of observation |
| λ | true value of the population rate |
| μ | true value of the population mean |
| Χ2(p, x) | upper x percentile point of the Χ2 distribution with p degrees of freedom, where 0 < x < 1. |
| α | alpha-level for the 100(1–α)% confidence interval |
| n | sample size |
P-value for normal approximation
Normal approximations are valid if the total number of occurrences is greater than 10.
Formula
The hypothesis test based on a normal approximation for 1-Sample Poisson Rate uses the following p-value equations for the respective alternative hypotheses:


Notation
| Term | Description |
|---|---|
| Z | 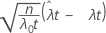 |
| t | "length" of observation |
| λ 0 | hypothesized value of the population rate parameter |
| λ | true value of the population rate parameter |
 | observed value of the sample rate statistic |
| n | sample size |
Confidence intervals and confidence bounds for normal approximation
Confidence intervals
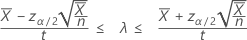
An 100(1 – α)% confidence interval, based on a normal approximation, for the occurrence rate of a Poisson process is given by:
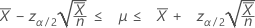
When you specify a value of "length", Minitab also displays a confidence interval for the mean number of occurrences. That confidence interval is given by:
Confidence bounds
When you specify a one-sided test, Minitab calculates a one-sided 100(1 – α)% confidence bound, according to the direction of the alternative hypothesis.-
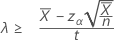
If you specify a "greater than" alternative hypothesis, the exact 100(1 – α)% lower bound of the rate is given by:
If you specify a value of "length", the exact 100(1-α)% lower bound of the mean is given by:

-
If you specify a "less than" alternative hypothesis, the exact 100(1 – α)% upper bound of the rate is given by:

If you specify a value of "length", the exact 100(1 – α)% upper bound of the mean is given by:

Notation
| Term | Description |
|---|---|
| s | total number of occurrences in the Poisson process |
| t | "length" of observation |
| λ | true value of the population rate |
| μ | true value of the population mean |
| Zx | upper x percentile point of the standard normal distribution, where 0 < x < 1. |
| α | alpha-level for the 100(1–α)% confidence interval |
 | mean number of occurrences in the sample |
| n | sample size |