Suppose you have a process with a target of 40, a lower specification limit of 38, and an upper specification limit of 42. You collect data in subgroups of size 5 and find that your process is nearly centered on target (process mean = 40.0016 and ST standard deviation = 0.960).
You add another 20 subgroups of size 5, and the ST standard deviation increases to 2.
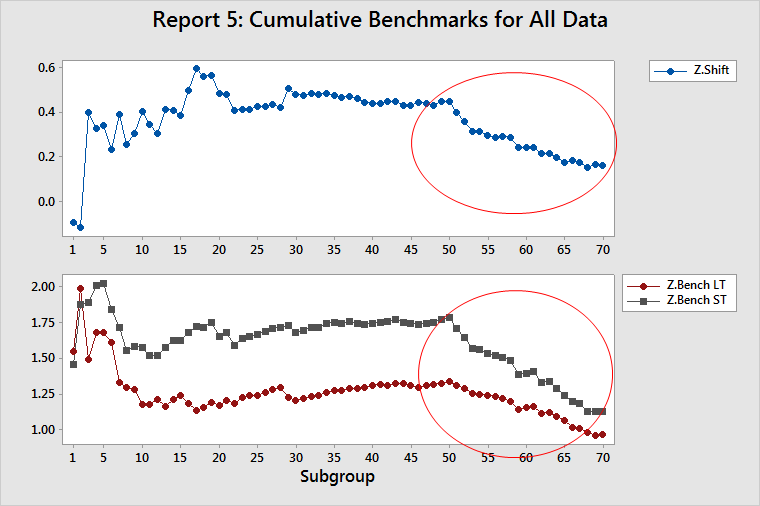
Report 1: Executive Summary
The cumulative DPMO lines (on the bottom left plot) become fairly flat, but then exhibit upward slopes. The ST DPMO (dashed) line has a more pronounced upward slope than the LT DPMO (solid) line. The process changed, and an investigation can help determine the assignable cause.
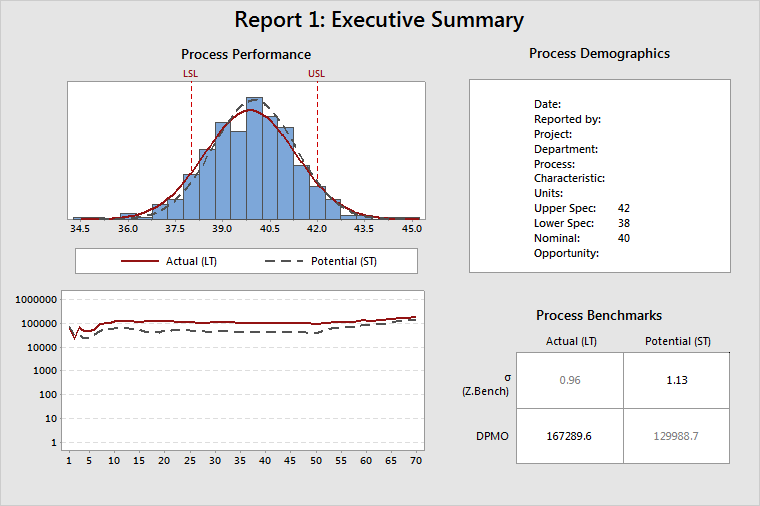
Report 4: Cumulative Statistics
- An increase in both LT and ST standard deviations
- A change in slope for both SS ST and SS LT
- No significant change in the mean
The ST standard deviation doubled from 1 to 2. That change is so dramatic that it actually dominates the decomposition of total process variability. That is, the SS Between component of variation becomes so small relative to the SS Within component that the SS LT and SS ST lines become almost parallel.
These results lead to one conclusion: the inherent variability of the process increased. A change in process variability affects SS Within subgroups, which is a component of both ST SS and LT SS. You can see in the cumulative SS (middle) plot the change in slopes that occur at subgroup 50. You can also see an obvious change in the cumulative StDev plot (top), but where the change occurs is less clear. The cumulative SS plot better displays the nature of the change, as well as the point where the change occurs.
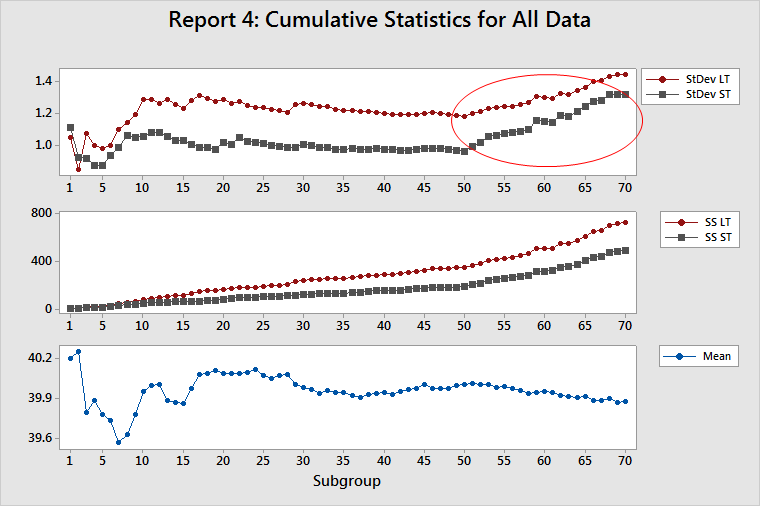
Report 5: Cumulative Benchmarks
This report displays the effect that the increase in process variability has on the Z statistics.
This behavior occurs because the process reports are based on different processes. You need to determine which process you want to perform the analysis on: the one before the change or the one after the change. After you make that decision, collect data only from that process and rerun the analysis. If you use these reports to validate project improvements, do not include that data that was collected before the improvements.