In This Topic
Step 1: Use the ANOVA table to identify significant factors and interactions
- Part: The variation that is from the parts.
- Operator: The variation that is from the operators.
- Nested factors: The variation that is from nested factors. Two factors are nested when each level of one factor occurs with only one level of the other factor. For example, if two operators measure two different, but similar, sets of parts, parts are nested under operator, and is indicated by Part (Operator). In this case, if the average measurement of different parts by each operator varies greatly, then Part (Operator) will be a significant source of variability.
- Interaction terms, such as Part*Operator: The variation that is from an interaction. For example, an interaction exists when an operator measures different parts differently.
- Error or repeatability: The variation that is not explained by part, operator, or other terms in the model.
If the p-value for an interaction is 0.05 or higher, Minitab omits the interaction because it is not significant and generates a second ANOVA table without the insignificant interactions.
ANOVA Table with All Terms
| Source | DF | Seq SS | Adj SS | Adj MS | F-Value | P-Value | |
|---|---|---|---|---|---|---|---|
| Part | 21 | 1071.30 | 1071.30 | 51.014 | 6.46 | 0.000 | |
| Operator | 2 | 32.18 | 32.18 | 16.089 | 3.27 | 0.164 | x |
| Station | 1 | 11.25 | 11.25 | 11.247 | 3.50 | 0.202 | |
| Part*Operator | 42 | 331.81 | 331.81 | 7.900 | 1.27 | 0.189 | |
| Operator*Station | 2 | 6.43 | 6.43 | 3.217 | 0.52 | 0.598 | |
| Repeatability | 63 | 390.53 | 390.53 | 6.199 | |||
| Total | 131 | 1843.50 |
ANOVA Table with Terms Used for Gage R&R Calculations
| Source | DF | Seq SS | Adj SS | Adj MS | F-Value | P-Value |
|---|---|---|---|---|---|---|
| Part | 21 | 1071.30 | 1071.30 | 51.014 | 7.49 | 0.000 |
| Operator | 2 | 32.18 | 32.18 | 16.089 | 2.36 | 0.099 |
| Station | 1 | 11.25 | 11.25 | 11.247 | 1.65 | 0.202 |
| Repeatability | 107 | 728.77 | 728.77 | 6.811 | ||
| Total | 131 | 1843.50 |
Key Result: P
In this example, the p-values for the interactions are greater than 0.05. The p-value for the Operator*Part interaction is 0.189, and the p-value for the Operator*Station interaction is 0.598. Thus, Minitab generates a second two-way ANOVA table that omits the interactions from the final model.
The second ANOVA table contains the terms used in the final gage R&R calculations. Part (0.000) is a significant source of measurement variation at the α = 0.05 level of significance. However, Operator (0.099) and Station (0.202) are probably not significant sources of measurement variation.
Step 2: Assess the variation for each source of measurement error
- Total Gage R&R: The sum of the repeatability and the reproducibility variance components.
- Repeatability: The variability in measurements when the same operator measures the same part multiple times.
- Reproducibility: The variability in measurements when different operators measure the same part at the various conditions defined by the other factors in the model. The Reproducibility term can be divided further into Operator, Operator*Part, and other main effects and interaction effects.
- Part-to-Part: The variability in measurements due to different parts. In addition to Part, other factors might be used to calculate part-to-part variation.
Ideally, very little of the variability should be due to repeatability and reproducibility. Differences between parts (Part-to-Part) should account for most of the variability.
Variance Components
| Source | VarComp | %Contribution (of VarComp) |
|---|---|---|
| Total Gage R&R | 7.1070 | 49.10 |
| Repeatability | 6.8109 | 47.06 |
| Reproducibility | 0.2961 | 2.05 |
| Operator | 0.2109 | 1.46 |
| Station | 0.0852 | 0.59 |
| Part-To-Part | 7.3672 | 50.90 |
| Part | 7.3672 | 50.90 |
| Total Variation | 14.4743 | 100.00 |
Key Results: VarComp, %Contribution
The %Contribution for the total gage R&R is 49.10%, which is approximately the same as part-to-part variation of 50.90%. The %Contribution for the repeatability variability is almost as high as the part-to-part value. When the %Contribution from the total gage R&R variation is much lower than the part-to-part variation, the measurement system can reliably distinguish between parts.
Gage Evaluation
| Source | StdDev (SD) | Study Var (6 × SD) | %Study Var (%SV) |
|---|---|---|---|
| Total Gage R&R | 2.66590 | 15.9954 | 70.07 |
| Repeatability | 2.60978 | 15.6587 | 68.60 |
| Reproducibility | 0.54413 | 3.2648 | 14.30 |
| Operator | 0.45921 | 2.7552 | 12.07 |
| Station | 0.29189 | 1.7514 | 7.67 |
| Part-To-Part | 2.71427 | 16.2856 | 71.34 |
| Part | 2.71427 | 16.2856 | 71.34 |
| Total Variation | 3.80450 | 22.8270 | 100.00 |
Key Result: %Study Var
Use the percent study variation (%Study Var) to compare the measurement system variation to the total variation. The %Study Var uses the process variation, as defined by 6 times the process standard deviation. Minitab displays the %Tolerance column when you enter a tolerance value, and Minitab displays the %Process column when you enter a historical standard deviation.
According to AIAG guidelines, if the measurement system variation is less than 10% of the process variation, then the measurement system is acceptable. Total Gage R&R is approximately 70% of the study variation. Repeatability is 68.60% of the study variation, which indicates that the measurement system does not measure the same part consistently. The measurement system might need improvement. For more information, go to Is my measurement system acceptable?.
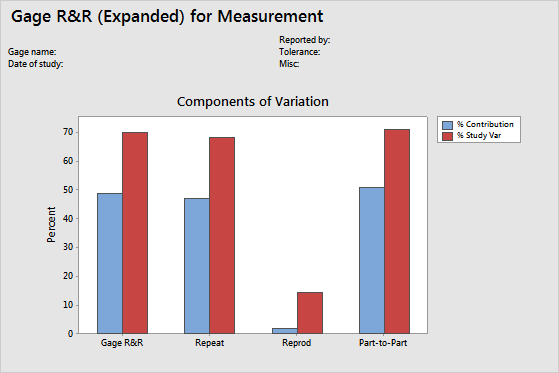
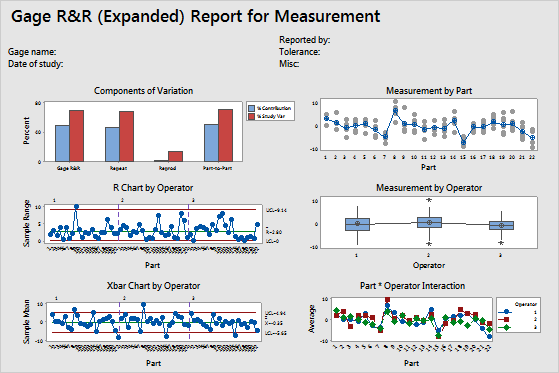
Key Result: Components of Variation graph
The components of variation graph shows the variation from the sources of measurement error. Minitab displays bars for %Tolerance when you enter a tolerance value, and Minitab displays bars for %Process when you enter a historical standard deviation.
This graph shows that part-to-part variability is approximately the same as the variability from repeatability and reproducibility. The total gage R&R variation is much higher than 30% and is unacceptable.
Step 3: Examine the graphs for more information on the gage study
- Components of variation graph
- Shows whether the largest of component of variation is part-to-part variation.
- R chart by operator
- Shows whether any points fall above the upper control limit.
- Xbar chart by operator
- Shows whether most points fall beyond the control limits.
- Measurements by a single factor
- Shows all measurements, arranged by one factor. This graph helps you visualize the differences between factor levels.
- Interaction plots
- Shows the interaction between two factors. An interaction occurs when the effect of one factor is dependent upon a second factor. This plot is the graphical analog of the F-test for an interaction term in the ANOVA table.