Stat > Control Charts > Multivariate Charts > Generalized Variance > Scale > Time
Specify a time scale for the x-axis.
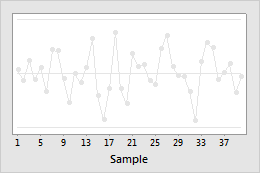
Index
Label the x-axis with the number of the subgroup.
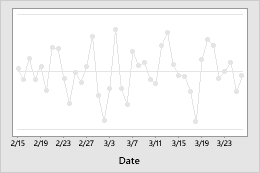
Stamp
Label the x-axis with values from a column. In Stamp columns (1-3, innermost first), enter up to three columns that contain date/time, numeric, or text values for the scale.