In This Topic
Pp
- The specification spread (USL – LSL)
- The spread of the process (the 6-σ variation) based on the overall standard deviation
You must provide both a lower specification limit (LSL) and an upper specification limit (USL) to calculate the Pp index.
Interpretation
Use Pp to evaluate the overall capability of your process based on the process spread. Overall capability indicates the actual performance of your process that your customer experiences over time.
Because Pp does not consider the location of the process, it indicates the overall capability that your process could achieve if it were centered. Generally, higher Pp values indicate a more capable process. Lower Pp values indicate that your process may need improvement.
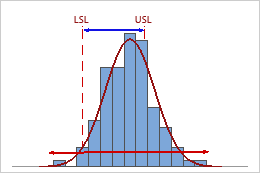
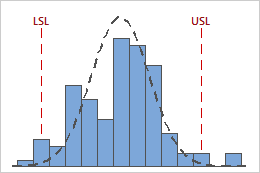
Low Pp
In this example, the specification spread is less than the overall process spread. Therefore, Pp is low (0.40), and the overall capability of the process is poor based on its variability.
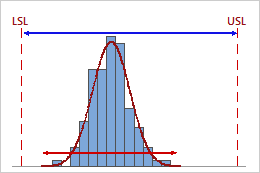
High Pp
In this example, the specification spread is considerably greater than the overall process spread. Therefore, Pp is high (1.80), and the overall capability of the process is good based on its variability.
-
Compare Pp to a benchmark value to assess the overall capability of your process. Many industries use a benchmark value of 1.33. If Pp is lower than your benchmark, consider how to improve your process by reducing its variation.
-
Compare Pp and Ppk. If Pp and Ppk are approximately equal, then the process is centered between the specification limits. If Pp and Ppk differ, then the process is not centered.
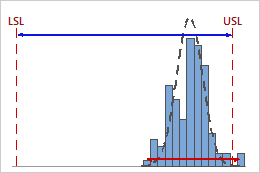
Caution
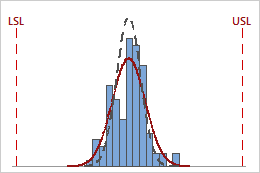
Pp = 2.27
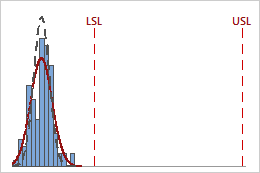
Pp = 2.27
For a complete and accurate analysis, use graphs in combination with other capability indices (such as Ppk) to draw meaningful conclusions from your data.
Ppk
- The distance from the process mean to the closest specification limit (USL or LSL)
- The one-sided spread of the process (the 3-σ variation) based on its overall variation
Interpretation
Use Ppk to evaluate the overall capability of your process based on both the process location and the process spread. Overall capability indicates the actual performance of your process that your customer experiences over time.
Generally, higher Ppk values indicate a more capable process. Lower Ppk values indicate that your process may need improvement.
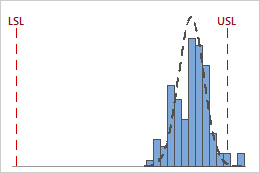
Low Ppk
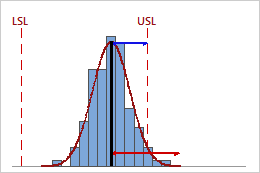
In this example, the distance from the process mean to the nearest specification limit (USL) is less than the one-sided process spread. Therefore, Ppk is low (0.66), and the overall capability of the process is poor.
High Ppk
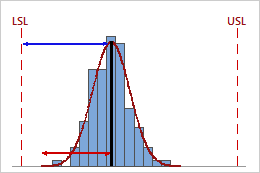
In this example, the distance from the process mean to the nearest specification limit (LSL) is greater than the one-sided process spread. Therefore, Ppk is high (1.68), and the overall capability of the process is good.
-
Compare Ppk to a benchmark value that represents the minimum value that is acceptable for your process. Many industries use a benchmark value of 1.33. If Ppk is lower than your benchmark, consider ways to improve your process.
-
Compare Pp and Ppk. If Pp and Ppk are approximately equal, then the process is centered between the specification limits. If Pp and Ppk differ, then the process is not centered.
-
Compare Ppk and Cpk. When a process is in statistical control, Ppk and Cpk are approximately equal. The difference between Ppk and Cpk represents the improvement in process capability that you could expect if shifts and drifts in the process were eliminated.
Caution
The Ppk index represents only one side of the process curve and does not measure how the process performs on the other side of the process curve.
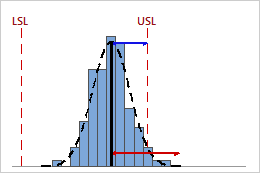
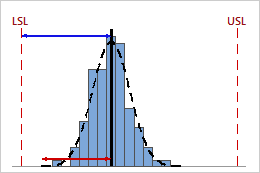
For example, the following graphs display two processes that have identical Ppk values. However, one process violates both specification limits, and the other process violates only the upper specification limit.
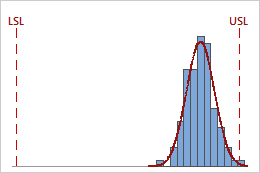
Ppk = min {PPL = 4.01, PPU = 0.64} = 0.64
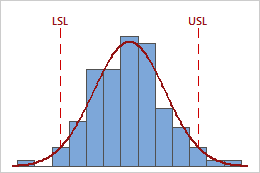
Ppk = PPL = PPU = 0.64
If your process has nonconforming parts that fall on both sides of the specification limits, consider using other indices, such as Z.bench, to more fully assess process capability.
Cpm
Cpm is a measure of the overall capability of the process. Cpm compares the specification spread to the spread of your process data while taking into account how much the data deviate from the target value.
You must provide a target value for Minitab to calculate the Cpm.
Interpretation
Use Cpm to evaluate the overall capability of your process relative to both the specification spread and the target. Overall capability indicates the actual performance of your process that your customer experiences over time.
Generally, higher Cpm values indicate that your process is more capable. Lower values indicate that your process may need improvement.
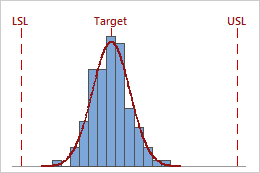
High Cpm
In this example, the data are on target and fall within the specification limits. Therefore, Cpm is high (1.60).

Low Cpm
In this example, the data fall inside of the specification limits, but the process is off target. Therefore, Cpm is low (1.03).

Low Cpm
In this example, the process is on target, but all of the data do not fall within the specification limits. Therefore, Cpm is low (0.48).
You can compare Cpm to other values to get more information about the capability of your process.
-
Compare Cpm with a benchmark value to assess the overall capability of your process. Many industries use a benchmark value of 1.33. If Cpm is lower than your benchmark, consider ways to improve your process, such as reducing its variation or shifting its location.
-
Compare Ppk and Cpm. If the process is centered on target, the Ppk and Cpm values are approximately equal.
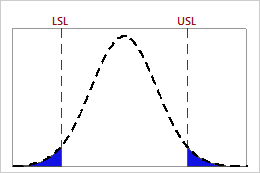
PPM Total for Expected Overall Performance
Interpretation
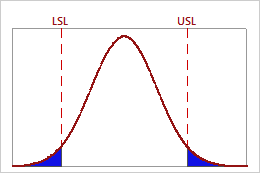
Use PPM Total for expected overall performance to estimate the number of nonconforming items, represented in parts per million, that you can expect to be outside the specification limits based on the overall variation of your process. Overall performance values indicate the actual process performance that your customer experiences over time.
Lower values of PPM Total indicate greater process capability. Ideally, few or no parts have measurements that are outside the specification limits.
| PPM | % Nonconforming Parts | % Conforming |
|---|---|---|
| 66807 | 6.6807% | 93.3193% |
| 6210 | 0.621% | 99.379% |
| 233 | 0.0233% | 99.9767% |
| 3.4 | 0.00034% | 99.99966% |
Z.Bench for Overall Capability
Z.bench (overall) is the percentile on a standard normal distribution that translates the estimated probability of defects in the process to an upper tail probability. It is calculated based on overall process performance, using the overall standard deviation.
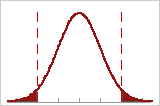
The defects for the process fall on both sides of the specification limits. The overall standard deviations are shown by the tick marks.
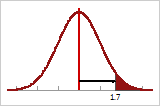
If you put all the defects on the right tail of the distribution, and then measure the number of overall standard deviations from the center (vertical line) to the point that defines the total defects, you obtain the Z-bench (overall) value.
Note
To display Z.bench measures, you must click Options and change the default output from capability statistics to benchmark Z's when you perform the capability analysis.
Interpretation
Use Z.Bench (overall) to evaluate the overall sigma capability of your process.
Generally, higher Z.bench values indicate a more capable process. Lower Z.bench values indicate that your process may need improvement. When possible, compare Z.bench with a benchmark value based on process knowledge or industry standards. If Z.Bench is lower than your benchmark, consider ways to improve your process.
Compare Z.Bench (within) and Z.Bench (overall). When a process is in statistical control, Z.Bench (within) and Z.Bench (overall) are approximately equal. The difference between the two values represents the improvement in process capability that you could expect if the process were brought into control. Z.bench (overall) is sometimes referred to as Z.Bench Long-Term (LT).
Cp (Between/Within)
- The specification spread (USL– LSL)
- The spread of the process (the 6-σ variation) based on the between/within standard deviation
Interpretation
Use Cp to evaluate the between/within capability of your process. Between/within capability indicates the capability that your process could achieve if systemic sources of overall process variation, besides the variation within and between the subgroups, were eliminated.
Because Cp does not consider the location of the process, it indicates the capability that your process could achieve if it were centered. Generally, higher Cp values indicate a more capable process. Lower values indicate that your process may need improvement.

Low Cp
In this example, the specification spread is less than the overall process spread. Therefore, Cp is low (0.40) and the capability of the process is poor based on its variability.
High Cp
In this example, the specification spread is considerably greater than the overall process spread. Therefore, Cp is high (1.80) and the overall capability of the process is good based on its variability.
-
Compare Cp to a benchmark value to assess the potential capability of your process. Many industries use a benchmark value of 1.33. If Cp is lower than your benchmark, consider how to improve your process by reducing its variation.
- Compare Cp and Pp. If Pp is considerably greater than Cp, there may be other sources of systemic variation in the process, in addition to the variation between and within the subgroups.
-
Compare Cp and Cpk. If Cp and Cpk are approximately equal, then the process is centered between the specification limits. If Cp and Cpk differ, then the process is not centered.
Caution
Because the Cp index does not consider the process location, it does not indicate how close the process is to the target region that is defined by the specification limits. For example, the following graphs show two processes with the same Cp value, yet one process falls within the specification limits and the other does not.
Cp = 3.13
Cp = 3.13
For a complete and accurate analysis, use graphs in combination with other capability indices (such as Cpk) to draw meaningful conclusions from your data.
Cpk (Between/Within)
- The distance from the process mean to the closest specification limit (USL or LSL)
- The one-sided spread (the 3-σ variation) of the process based on between/within subgroup standard deviation
Interpretation
Use Cpk to evaluate the between/within capability, considering both its location and spread. Between/within capability indicates the capability that your process could achieve if systemic sources of overall process variation, besides the variation within and between the subgroups, were eliminated.
Generally, higher Cpk values indicate a more capable process. Lower Cpk values indicate that your process may need improvement.
Low Cpk
In this example, the distance from the process mean to the nearest specification limit is less than the one-sided process spread. Therefore, Cpk is low (0.66) and the between/within capability of the process is poor.
High Cpk
In this example, the distance from the process mean to the nearest specification limit is greater than the one-sided process spread. Therefore, Cpk is high (1.68) and the between/within capability of the process is good.
-
Compare Cpk with a benchmark that represents the minimum value that is acceptable for your process. Many industries use a benchmark value of 1.33. If Cpk is lower than your benchmark, consider ways to improve your process, such as reducing its variation or shifting its location.
- Compare Cpk and Ppk. If Cpk is considerably greater than Ppk, there may be other sources of systemic variation in the process, in addition to the variation between and within the subgroups. For example, tool wear is a systemic source of variation that could cause a manufacturing process to exhibit greater between/within capability (Cpk) than overall capability (Ppk).
-
Compare Cp and Cpk. If Cp and Cpk are approximately equal, then the process is centered between the specification limits. If Cp and Cpk differ, then the process is not centered.
Caution
The Cpk index represents only one side of the process curve, and does not measure how the process performs on the other side of the process curve.
For example, the following graphs display two processes with identical Cpk values. However, one process violates both specification limits, and the other process only violates the upper specification limit.
Cpk = min {CPL = 4.58, CPU = 0.93} = 0.93
Cpk = CPL = CPU = 0.93
If your process has nonconforming parts that fall on both sides of the specification limits, consider using other indices, such as Z.bench, to more fully assess process capability.
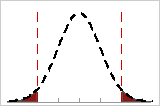
PPM Total for Expected Between/Within Performance
The probability that a randomly selected part is outside the specification limits is shown by the shaded regions under the between/within normal curve.
Interpretation
Use PPM Total for expected between/within performance to estimate the number of nonconforming items, represented in parts per million, that you can expect to be outside the specification limits based on the variation between/within the subgroups. Between/within performance values indicate the performance that could be achieved if additional sources of systemic process variation, besides the variation between and within subgroups, could be eliminated.
Lower values of PPM Total indicate greater process capability. Ideally, few or no parts have measurements that are outside the specification limits.
| PPM | % Nonconforming Parts | % Conforming |
|---|---|---|
| 66807 | 6.6807% | 93.3193% |
| 6210 | 0.621% | 99.379% |
| 233 | 0.0233% | 99.9767% |
| 3.4 | 0.00034% | 99.99966% |
Z.Bench for Between/Within Capability
Z.bench (between/within) is the percentile on a standard normal distribution that translates the estimated probability of defects in the process to an upper tail probability. It is calculated based on the between/within process performance, using the between/within standard deviation.
The defects for the process fall on either side of the specification limits. The between/within subgroup standard deviations are shown by the tick marks.
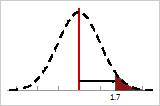
If you put all the defects on the right tail of the distribution, and then measure the number of between/within- subgroup standard deviations from the center (red line) to the point that defines the total defects, you obtain the Z-bench (between/within) value.
Note
To display Z.bench, you must click Options and change the default output from capability statistics to benchmark Z's when you perform the capability analysis.
Interpretation
Use Z.Bench (between/within) to evaluate the between/within sigma capability of your process.
Generally, higher Z.bench (between/within) values indicate that the process is more capable. Lower values indicate that your process may need improvement. When possible, compare Z.bench (between/within) with a benchmark value based on process knowledge or industry standards. If Z.bench (between/within) is less than your benchmark, consider ways to improve your process.