Note
This command is available with the Predictive Analytics Module. Click here for more information about how to activate the module.
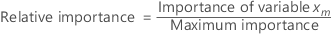
Important variables

| Term | Description |
|---|---|
 | value of the response variable for row i |
 | number rows that appear in the out-of-bag data over the entire forest |
 | out-of-bag prediction for row i |
Then, randomly permute the values of a variable,
xm through the out-of-bag data. Leave the response values
and the other predictor values the same. Then, use the same steps to calculate
the mean squared error for the permuted data,  .
.
The importance for variable xm comes from the difference of the two mean squared errors:

Minitab rounds values smaller than 10–7 to 0.
Out-of-bag and test predictions
The predicted calculations for the following measures of model accuracy depend on the validation method. The out-of-bag predictions come only from the trees where a row is out-of-bag. For a given tree, j, in the analysis, predict the out-of-bag data with the tree. Repeat the prediction for every tree in the forest. Then, compute the average of the out-of-bag predictions for each row that appears at least once in the out-of-bag data. For the evaluation of the model with the out-of-bag data, the average of the response variable is the average across all rows in the out-of-bag data.
For the test data set, use each tree in the forest to predict each value in the test data set. Then, average the predictions from all the trees to get the prediction for the model. For the evaluation of the model with the test set, the average response is the average of the rows in the test set.
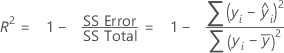
R-squared
The calculation of R2 uses the out-of-bag data or the test data. The predictions differ in these two cases. In general, the formula for R2 has the following form:
Root mean squared error (RMSE)

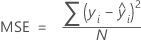
Mean squared error (MSE)
Mean absolute deviation (MAD)

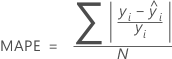
Mean absolute percent error (MAPE)
Notation
| Term | Description |
|---|---|
| yi |  observed response value
 |
 | mean response |
 | predicted response value for row
 |
| N | number of rows |