Pareto chart
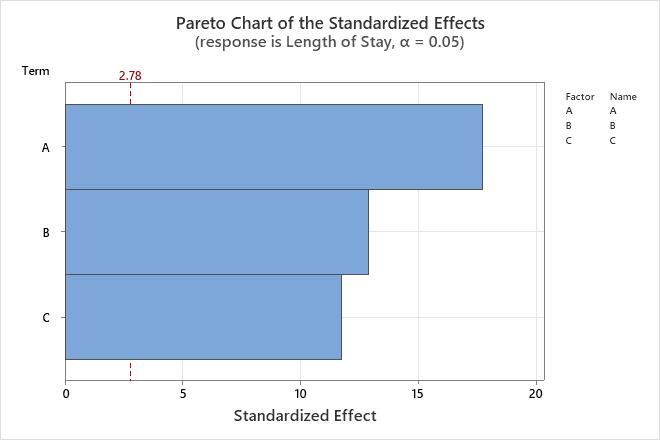
The Pareto chart shows the absolute values of the standardized effects from the largest effect to the smallest effect. The standardized effects are t-statistics that test the null hypothesis that the effect is 0. The chart also plots a reference line to indicate which effects are statistically significant.
The reference line for statistical significance depends on the significance level (denoted by α or alpha). Unless you use a stepwise selection method that defines an alpha value, the significance level is 1 minus the confidence level for the analysis. For more information on how to change the confidence level, go to Specify the options for Analyze Definitive Screening Design. If you use backwards selection or stepwise selection, the significance level is the significance level where Minitab removes a term from the model, known as Alpha to remove. If you use forward selection, the significance level is the significance level where Minitab adds a term to the model, known as Alpha to enter.
Interpretation
Use the Pareto chart to determine the magnitude and the importance of the effects. On the Pareto chart, bars that cross the reference line are statistically significant.
For example, in this Pareto chart, the bars that represent factors A, B, and C cross the reference line. These factors are statistically significant at the 0.05 level with the current model terms.
Because the Pareto chart displays the absolute value of the effects, you can determine which effects are large but you cannot determine which effects increase or decrease the response. Use the normal probability plot of the standardized effects to examine the magnitude and direction of the effects on one plot.
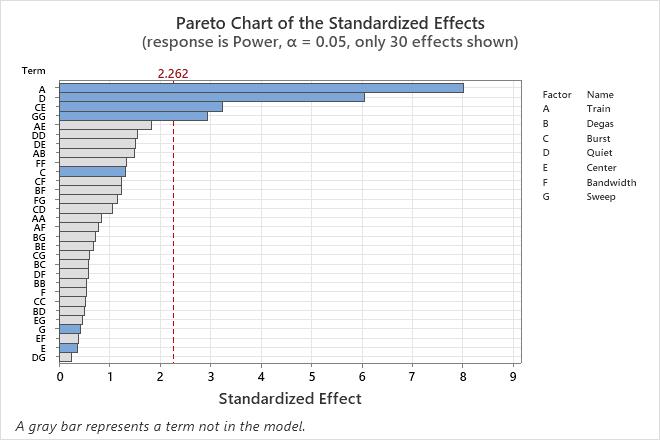
In the first pareto chart, all of the bars are blue because all of the terms are in the model. You can choose to show terms that are not in the model. For more information, go to Select the graphs to display for Analyze Definitive Screening Design. The terms that are not in the model are gray.
For example, in this pareto chart, the blue bars represent the terms that are in the model. The analyst included the terms that are significant at the 0.05 level (A, D, CE, and GG). The analyst also included the terms that make the model hierarchical (C, G,and E).
Normal plot of the effects
The normal probability plot of the effects shows the standardized effects relative to a distribution fit line for the case when all the effects are 0. The standardized effects are t-statistics that test the null hypothesis that the effect is 0. Positive effects increase the response when the settings change from the low value of the factor to the high value. Negative effects decrease the response when they settings change from the low value of the factor to the high value of the factor. Effects further from 0 on the x-axis have greater magnitude. Effects further from 0 are more statistically significant.
The reference value for statistical significance depends on the significance level (denoted by α or alpha). Unless you use a stepwise selection method that defines an alpha value, the significance level is 1 minus the confidence level for the analysis. For more information on how to change the confidence level, go to Specify the options for Analyze Definitive Screening Design. If you use backwards selection or stepwise selection, the significance level is the significance level where Minitab removes a term from the model, known as Alpha to remove. If you use forward selection, the significance level is the significance level where Minitab adds a term to the model, known as Alpha to enter.
Interpretation
Use the normal probability plot of the effects to determine the magnitude, direction, and the importance of the effects. On the normal probability plot of the effects, effects that are further from 0 are statistically significant. The color and shape of the points differ between statistically significant and statistically insignificant effects.
For example, on this plot, the main effects A and D are statistically significant at the 0.05 level. The CE interaction and the GG quadratic term are also statistically significant. These points have a different color and shape from the points for the insignificant effects.
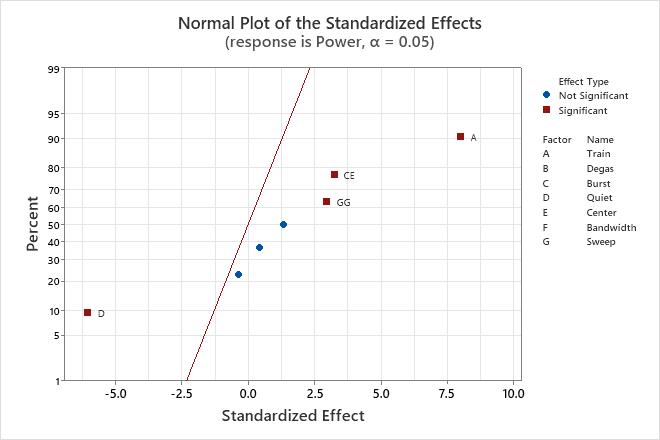
In addition, the plot indicates the direction of the effect. Train (A) has a positive standardized effect. When this factor changes from the low level of the factor to the high level of the factor, the response increases. Quiet (D) has a negative standardized effect. When Quiet increases, the response decreases.
Because the normal probability plot of the effects displays negative effects on the left side of the graph and positive effects on the right side of the graph, comparisons about which effects change the response the most are more difficult than on plots that show the absolute values of the standardized effects. The half normal plot and the Pareto chart show the absolute values of the standardized effects.
Half normal plot of the effects
The half normal probability plot of the effects shows the absolute values of the standardized effects. The standardized effects are t-statistics that test the null hypothesis that the effect is 0. The points are shown relative to a distribution fit line for the case when all the effects are 0. Effects further from 0 on the x-axis have greater magnitude. Effects further from 0 are more statistically significant.
The reference value for statistical significance depends on the significance level (denoted by α or alpha). Unless you use a stepwise selection method that defines an alpha value, the significance level is 1 minus the confidence level for the analysis. For more information on how to change the confidence level, go to Specify the options for Analyze Definitive Screening Design. If you use backwards selection or stepwise selection, the significance level is the significance level where Minitab removes a term from the model, known as Alpha to remove. If you use forward selection, the significance level is the significance level where Minitab adds a term to the model, known as Alpha to enter.
Interpretation
Use the half normal probability plot of the effects to determine the magnitude and the importance of the effects. On the half normal probability plot of the effects, effects that are further from 0 are more statistically significant. The color and shape of the points differ between statistically significant and statistically insignificant effects.
For example, on this plot, the main effects A and D are statistically significant at the 0.05 level. The CE interaction and the GG quadratic term are also statistically significant. These points have a different color and shape from the points for the insignificant effects.
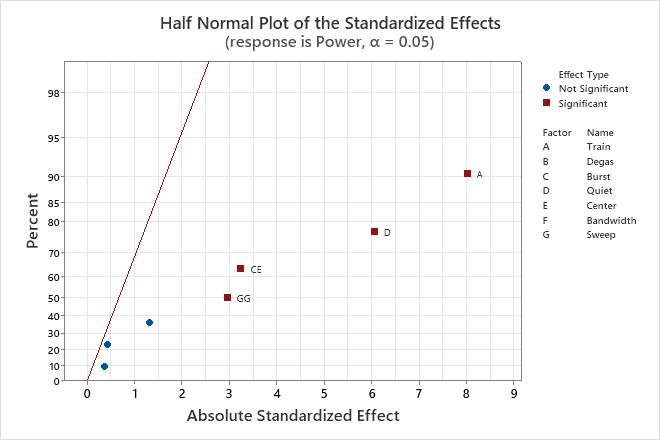
Because the half normal probability plot of the effects displays the absolute value of the effects, you can determine which effects are large but you cannot determine which effects increase or decrease the response. Use the normal probability plot of the standardized effects to see the magnitude and direction of the effects on one plot.