- Effect
- You can enter the label for the effect or problem that you are trying to solve. The text is displayed to the right of the diagram. The labels can contain up to 72 characters.
- Title
- You can enter a custom title for the cause-and-effect diagram.
- Do not label the branches
- Create a blank cause-and-effect diagram that does not include labels. For example, team members can use a blank diagram during a brainstorming session to record their ideas.
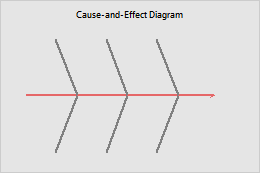
- Do not display empty branches
- By default, Minitab displays 6 branches even if you don't have data for all 6 branches. You can choose to only display branches for which you have data.