What are common-cause variation and special-cause variation?
Some degree of variation will naturally occur in any process. Common-cause variation is the natural or expected variation in a process. Special-cause variation is unexpected variation that results from unusual occurrences. It is important to identify and try to eliminate special-cause variation. Out-of-control points and nonrandom patterns on a control chart indicate the presence of special-cause variation.
Examples of common-cause and special-cause variation
| Process | Common cause of variation | Special cause of variation |
|---|---|---|
| Baking a loaf of bread | The oven's thermostat allows the temperature to drift up and down slightly. | Changing the oven's temperature or opening the oven door during baking can cause the temperature to fluctuate needlessly. |
| Recording customer contact information | An experienced operator makes an occasional error. | An untrained operator new to the job makes numerous data-entry errors. |
| Injection molding of plastic toys | Slight variations in the plastic from a supplier result in minor variations in product strength from batch to batch. | Changing to a less reliable plastic supplier leads to an immediate shift in the strength and consistency of your final product. |
What special-cause variation looks like on a control chart
A process is stable if it does not contain any special-cause variation; only common-cause variation is present. Control charts and run charts provide good illustrations of process stability or instability. A process must be stable before its capability is assessed or improvements are initiated.
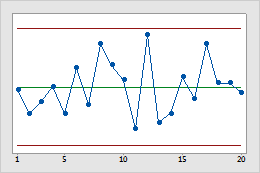
This process is stable because the data appear to be distributed randomly and do not violate any of the 8 control chart tests.
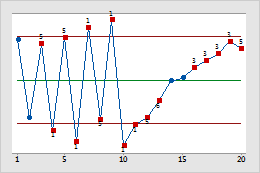
This process is not stable; several of the control chart tests are violated.
Using brainstorming to investigate special-cause variation
A good starting point in investigating special-cause variation is to gather several process experts together. Using the control chart, encourage the process operators, the process engineers, and the quality testers to brainstorm why particular samples were out of control. Depending on your process, you may also want to include the suppliers in this meeting.
- Which samples were out of control?
- Which tests for special causes did the samples fail?
- What does each failed test mean?
- What are all the possible reasons for the failed test?
A common method for brainstorming is to ask questions about why a particular failure occurred to determine the root cause (the 5 why method). You could also use a cause-and-effect diagram (also called fishbone diagram).
Don't overcorrect your process for common-cause variation
While it's important to avoid special-cause variation, trying to eliminate common-cause variation can make matters worse. Consider a bread baking process. Slight drifts in temperature that are caused by the oven's thermostat are part of the natural common-cause variation for the process. If you try to reduce this natural process variation by manually adjusting the temperature setting up and down, you will probably increase variability rather than decrease it. This is called overcorrection.