or
Complete the following steps to specify the data for your graph.
- In Series, enter multiple columns of time-ordered numeric or date/time data that you want to appear on the plot.
- In Categorical variables for grouping (1-3), enter up to three columns of categorical data that define the groups.
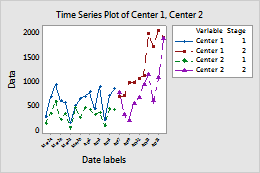
A manager tracks the number of calls that sales representatives at 2 call centers receive during two stages of an advertising campaign. Each day, the manager records the number of calls for each call center in the Center 1 and Center 2 columns and identifies the stage of the campaign in the Stage column. The Y variable is Calls and the group variable is Stage. The manager also enters the dates in the Date labels column to use as the time stamp.
| C1 | C2 | C3 | C4-T |
|---|---|---|---|
| Center 1 | Center 2 | Stage | Date labels |
| 281 | 147 | 1 | Mar 23 |
| 688 | 354 | 1 | Mar 24 |
| ... | ... | ... | |
| 687 | 775 | 2 | Apr 7 |
| 717 | 315 | 2 | Apr 8 |
| ... | ... | ... |