Note
This command is available with the Predictive Analytics Module. Click here for more information about how to activate the module.
Total predictors
The number of total predictors available for the Random Forests® model. The total is the sum of the continuous and categorical predictors that you specify.
Important predictors
The number of important predictors in the Random Forests® model. Important predictors have importance scores greater than 0.0. You can use the Relative Variable Importance chart to display the order of relative variable importance. For instance, suppose 10 of 20 predictors are important in the model, the Relative Variable Importance chart displays the variables in importance order.
R-squared
R2 is the percentage of variation in the response that the model explains.
Interpretation
Use R2 to determine how well the model fits your data. The higher the R2 value, the better the model fits your data. R2 is always between 0% and 100%.
Note
Because Random Forests® use out-of-bag data to calculate R2, but not to fit the model, overfitting of the model is not a concern.
Root mean square error (RMSE)
The root mean square error (RMSE) measures the accuracy of the model. Outliers have a greater effect on RMSE than on MAD and MAPE.
Interpretation
Use to compare the fits of different models. Smaller values indicate a better fit.
Mean squared error (MSE)
The mean square error (MSE) measures the accuracy of the model. Outliers have a greater effect on MSE than on MAD and MAPE.
Interpretation
Use to compare the fits of different models. Smaller values indicate a better fit.
Mean absolute deviation (MAD)
The mean absolute deviation (MAD) expresses accuracy in the same units as the data, which helps conceptualize the amount of error. Outliers have less of an effect on MAD than on R2, RMSE, and MSE.
Interpretation
Use to compare the fits of different models. Smaller values indicate a better fit.
Mean absolute percent error (MAPE)
The mean absolute percent error (MAPE) expresses the size of the error relative to the size of the response value. Thus, the same size error will have a larger MAPE value for a smaller value of the response variable than for a larger value. Because the MAPE is a percentage, it can be easier to understand than the other accuracy measure statistics. For example, if the MAPE, on average, is 0.05, then the average ratio between the fitted error and the actual value across all cases is 5%. Outliers have less of an effect on MAPE than on R2, RMSE, and MSE.
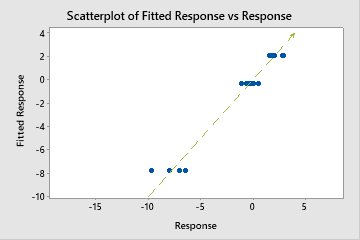
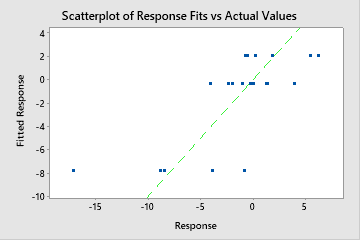
However, sometimes you may see a very large MAPE value even though the model appears to fit the data well. Examine the fitted vs actual response value plot to see if any data values are close to 0. Because MAPE divides the absolute error by the actual data, values close to 0 can greatly inflate the MAPE.
Interpretation
Use to compare the fits of different models. Smaller values indicate a better fit.