Note
This command is available with the Predictive Analytics Module. Click here for more information about how to activate the module.
The Relative Variable Importance graph plots the predictors in order of their effect on model improvement when splits are made on a predictor over the entire forest. The variable with the highest improvement score is set as the most important variable, and the other variables follow in order of importance. Relative variable importance standardizes the importance values for ease of interpretation. Relative importance is defined as the percent improvement with respect to the most important predictor, which has an importance of 100%.
Relative importance is calculated by dividing each variable importance score by the largest importance score of the variables, then we multiply by 100%.
Interpretation
Relative variable importance values range from 0% to 100%. The most important variable always has a relative importance of 100%. If a variable is not used in any of the trees, then the variable is not important.
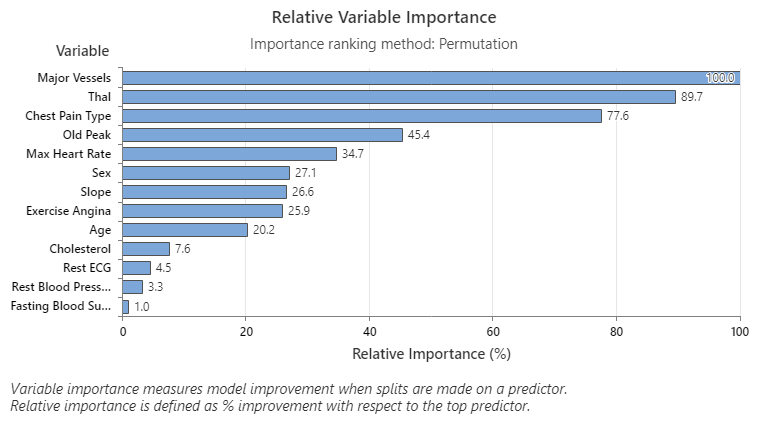
The most important predictor variable is Major Vessels. If the contribution of the top predictor variable, Major Vessels, is 100%, then the next important variable in this example, Thal, has a contribution of 89.7%. This means Thal is 89.7% as important as Major Vessels in this classification model.