In This Topic
Step 1: Examine the average measurement with variation
Use the variability charts as a preliminary tool to investigate variation in your data, including cyclical variations and interactions between factors. An interaction occurs when the change in response from one level of a factor to another level depends upon the level of another factor.
The variability chart displays a mean for each combination of factor levels. In Minitab, each variability chart can display up to eight factors.
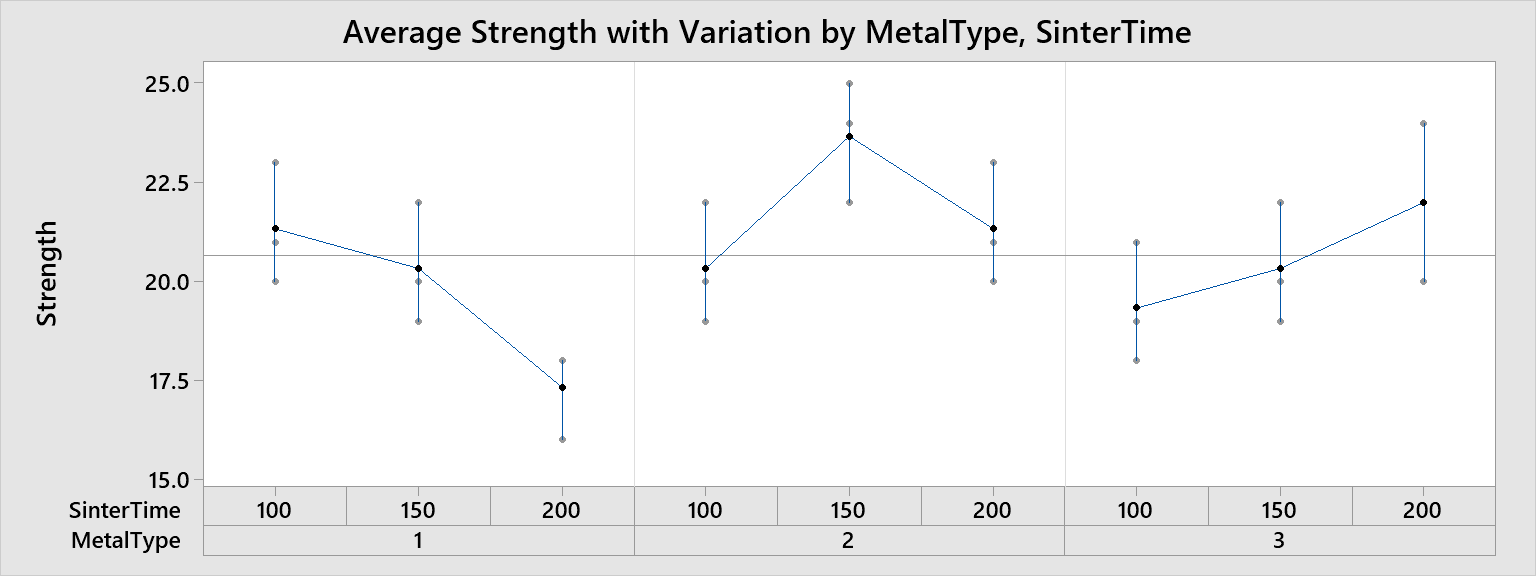
This chart indicates a possible interaction between metal type and sintering time for the compressive strength of metals. The greatest compressive strength for Metal Type 1 is obtained by sintering for 100 minutes, for Metal Type 2 by sintering for 150 minutes, and for Metal Type 3 by sintering for 200 minutes.
Step 2: Examine the standard deviation chart
Variability charts are also used to examine the variability between factor levels.
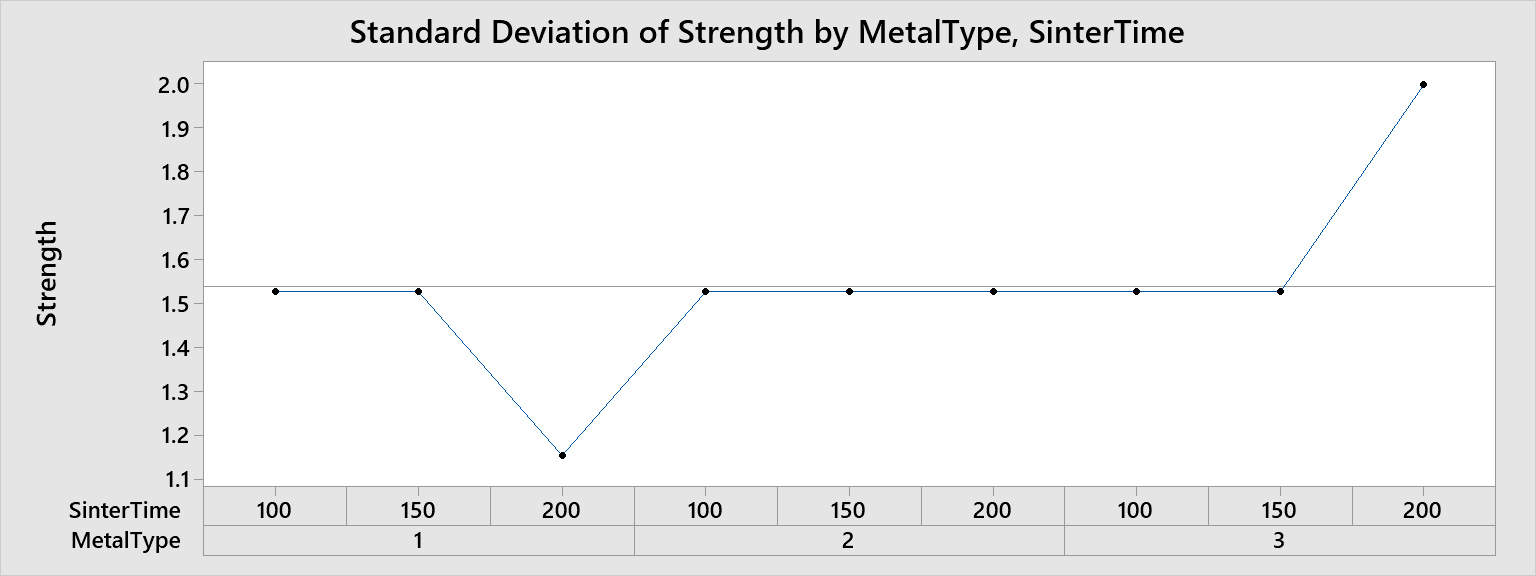
The standard deviation chart shows relatively constant standard deviations for the sinter times of 100 and 150. The standard deviation varies more with the sintering time of 200.