Use Pareto Chart to identify the most frequent defects, the most common causes of defects, or the most frequent causes of customer complaints. Pareto charts can help to focus improvement efforts on areas where the largest gains can be made.
For example, a manager wants to investigate causes of customer dissatisfaction at a particular
hotel. The manager investigates and records reasons for customer complaints. 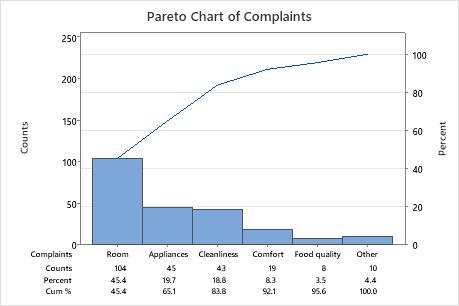
Where to find this analysis
To create a Pareto chart, choose .