Engineers at a manufacturing plant discovered that parts are rejected most often because of surface flaws. The engineers meet with members of several departments to brainstorm potential causes for surface flaws.
The engineers creates a cause-and-effect diagram to organize the causes that the team has identified.
- Open the sample data, SurfaceFlaws.MWX.
- Choose .
- Under Causes for Branch 1, select In column from the drop-down menu.
- In the blank field under Causes for Branch 1, enter Man.
- Repeat steps 3 and 4 for the next 5 branches. Enter Machine, Material, Method, Measure, and Enviro in branches 2–6.
- In Effect, type Surface Flaws.
- Click OK.
Interpret the results
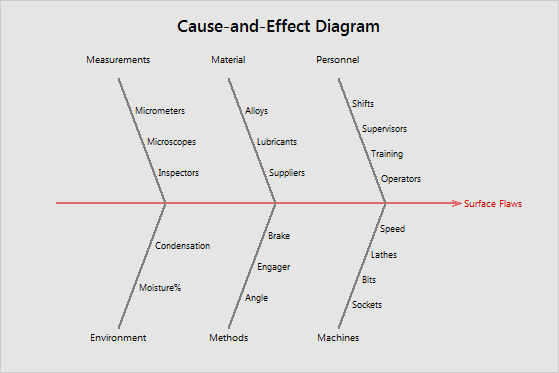
The team identified various causes of surface flaws, which is the effect, or the dependent variable. The limbs on the branches—for example, Condensation and Moisture% under Environment—are the causes (or the factors) that might contribute to the effect.