The center line of your control chart represents your actual process average, not necessarily your desired process average.
The center line is the horizontal reference line on a control chart that is the average value of the charted quality characteristic. Use the center line to observe how the process performs compared to the average. If a process is in control, the points will vary randomly around the center line.
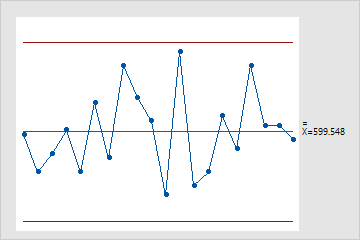
For example, the following Xbar chart displays the length of manufactured camshafts over time. The center line shows the process mean. The subgroup means vary randomly around the process mean.
Do not confuse the center line with the target value for your process. The target is your desired outcome, not the actual outcome.