The same subgroup size must be used for more than half of the subgroups in order to calculate the between and between/within standard deviations.
Suppose you have one subgroup of size 5, one subgroup of size 7, and one subgroup of size 4. So you have a total of three subgroups with three different sizes. Therefore, each subgroup size occurs one-third of the time and no one subgroup size occurs more than half of the time. You would have to add two more subgroups of size 5 (for example) to create a situation where one subgroup size is used for more than half of the subgroups.
Within
The standard deviation within subgroups, which is an estimate of the variation within subgroups (for example, one shift, one operator, or one material batch). This value equals the estimated standard deviation for the R or S chart.Between
The standard deviation between subgroups, or an estimate of the variation between subgroups (for example, subgroups collected at set intervals, batches, or by different operators).

where batch size is the mode of the subgroup sizes.
If you specify a historical between standard deviation, then

Notation
| Term | Description |
|---|---|
 | estimated standard deviation for the I and MR charts (average moving range is the default) |
Between/within total
The between/within standard deviation, combining within and between variation.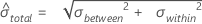
For more information about the I-MR-R/S chart, see Janis 1.