A quality engineer from a plastic manufacturing company would like to make sure his batch process stays in control. The engineer measures the concentration of pigment of each batch for all 35 batches.
- Open the sample data, PigmentConcentration.MWX.
- Choose .
- From the drop-down list, select All observations for a chart are in one column, enter Pigment.
- In Subgroup sizes, enter 1.
- Click OK.
Interpret the results
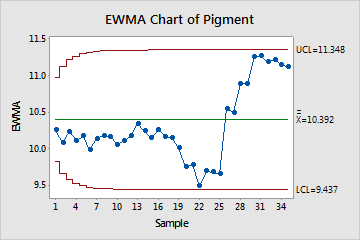
For the pigment data, no points are out of control. However, the process level shifts starting at subgroup 26. The engineer should examine the process for special-cause variation.