A quality engineer wants to evaluate a wire insulation process. The engineer randomly selects lengths of electrical wire and tests them for weak spots in the insulation by subjecting them to a test voltage. She records the number of weak spots (defects) and the length of each wire in meters.
The engineer performs Poisson capability analysis to evaluate how well the wire insulation process meets requirements.
- Open the sample data, WireDefects.MWX.
- Choose .
- In Defects, enter Weak Spots.
- Under Sample size, select Use sizes in and enter Length.
- Click OK.
Interpret the results
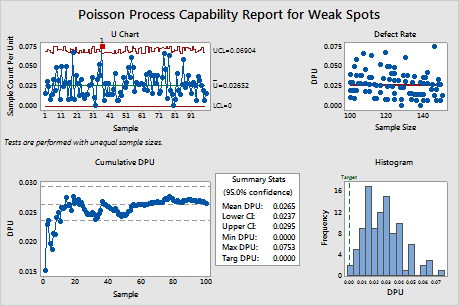
The Defect Rate graph indicates that the defects per unit of measurement slightly decrease as the sample size increases. The U chart indicates that the process is stable except for one out-of-control point. The engineer may need to investigate the sample size effect and process instability to ensure that the assumptions for capability analysis are satisfied.
The cumulative defects per unit (DPU) chart indicates that the DPU is relatively stable. The estimated mean DPU is 0.0265. Therefore, a defect (weak spot) in the wire occurs, on average, once every 37.7 (1/0.0265) meters. The confidence interval (CI) for DPU indicates that the engineer can be 95% confident that the mean DPU is contained within the interval 0.0237 and 0.0295. The engineer should consider how improving the process could further reduce the DPU.