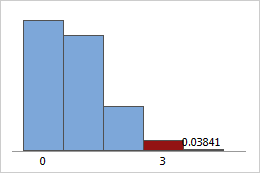
What is the hypergeometric distribution?
The hypergeometric distribution is a discrete distribution that models the number of events in a fixed sample size when you know the total number of items in the population that the sample is from. Each item in the sample has two possible outcomes (either an event or a nonevent). The samples are without replacement, so every item in the sample is different. When an item is chosen from the population, it cannot be chosen again. Therefore, an item's chance of being selected increases on each trial, assuming that it has not yet been selected.
Use the hypergeometric distribution for samples that are drawn from relatively small populations, without replacement. For example, the hypergeometric distribution is used in Fisher's exact test to test the difference between two proportions, and in acceptance sampling by attributes for sampling from an isolated lot of finite size.
The hypergeometric distribution is defined by 3 parameters: population size, event count in population, and sample size.

Example of calculating hypergeometric probabilities
Suppose that there are ten cars available for you to test drive (N = 10), and five of the cars have turbo engines (x = 5). If you test drive three of the cars (n = 3), what is the probability that two of the three cars that you drive will have turbo engines?
- Choose .
- Choose Probability.
- In Population size (N), enter 10. In Event count in population (M), enter 5. In Sample size (n), enter 3.
- Choose Input constant, and enter 2.
- Click OK.
The probability that you will randomly select exactly two cars with turbo engines when you test drive three of the ten cars is 41.67%.
The difference between the hypergeometric and the binomial distributions
Both the hypergeometric distribution and the binomial distribution describe the number of times an event occurs in a fixed number of trials. For the binomial distribution, the probability is the same for every trial. For the hypergeometric distribution, each trial changes the probability for each subsequent trial because there is no replacement.
Use the binomial distribution with populations so large that the outcome of a trial has almost no effect on the probability that the next outcome is an event or non-event. For example, in a population of 100,000 people, 53,000 have O+ blood. The probability that the first randomly-selected person in a sample has O+ blood is 0.530000. If the first person in a sample has O+ blood, then the probability that the second person has O+ blood is 0.529995. The difference between these probabilities is small enough to ignore for most applications.
Use the hypergeometric distribution with populations that are so small that the outcome of a trial has a large effect on the probability that the next outcome is an event or non-event. For example, in a population of 10 people, 7 people have O+ blood. The probability that the first randomly-selected person in a sample has O+ blood is 0.70000. If the first person in the sample has O+ blood, then the probability that the second person has O+ blood is 0.66667. The difference can increase as the sample size increases. The difference between these probabilities is too large to ignore for many applications.
