Step 1: Look for evidence of interactions
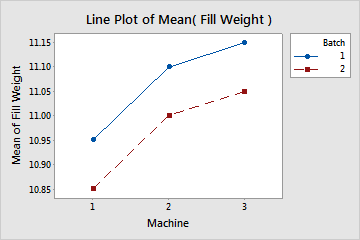
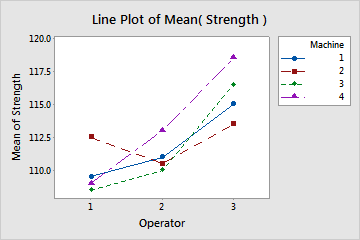
If the lines on the plot are not parallel, an interaction may exist. An interaction indicates that the means of the Y data at the levels of the first X variable are different at each level of the second X variable. The more nonparallel the lines are, the greater the strength of the interaction.
Note
Although you can use the line plot to display effects and interactions, you should perform the appropriate statistical test to evaluate the statistical significance of any effects or interactions that you see. If the interaction effects are significant, you cannot interpret the main effects without considering the interaction effects.
Step 2: Look for evidence of effects
Sloped lines suggest a possible effect due to the x-factor. Differences between lines suggest a possible effect due to the legend factor. Evaluate possible effects (or lack of effects) in relation to your study objectives.
- Goal for Y
- Look for levels of X variables that minimize Y, maximize Y, or come closest to reaching a Y target value.
- Robustness of Y to changes in X
- Look for levels of one X variable that make Y robust to changes in the other X variable. For example, identify whether the mean of Y is nearly the same at all settings of the X variable on the s-axis of the graph, or at all settings of the X variable in the legend.