Complete the following steps to specify the data for your graph.
- In Graph variables, enter multiple columns of numeric or date/time data that you want to graph.
- In Label column (optional), enter the column of categorical data with labels for the series. If you don't enter a label column, Minitab labels the groups formed by the rows with the row number.
- From Series Arrangement, select one of the following:
- Each row forms a series: Rows form the series. The rows are labeled with the values in the label column.
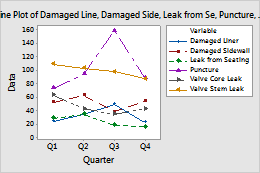
- Each column forms a series: Graph variables form the series. On the graph below, the columns in the worksheet are the graph variables for the series.
In this worksheet, Damaged Liner, Damaged Sidewall, Leak from Seating, Puncture, Valve Core Leak, and Valve Stem Leak are the graph variables. Quarter is the label column. The graph shows a series for each damage type of the number of defective tires for each quarter.
| C1-T | C2 | C3 | C4 | C5 | C6 | C7 |
|---|---|---|---|---|---|---|
| Quarter | Damaged Liner | Damaged Sidewall | Leak from Seating | Puncture | Valve Core Leak | Valve Stem Leak |
| Q1 | 25 | 53 | 29 | 73 | 63 | 109 |
| Q2 | 34 | 63 | 35 | 94 | 43 | 103 |
| Q3 | 50 | 39 | 19 | 158 | 35 | 98 |
| Q4 | 23 | 54 | 17 | 89 | 43 | 87 |