Step 1: Assess the key characteristics
Examine the center of the distribution. Assess how the sample size may affect the appearance of the interval plot.
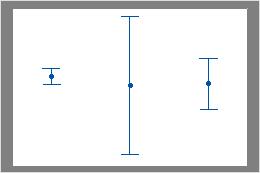
Center
- Confidence interval
- The confidence interval is a range of values that is likely to include the population mean.
- Sample mean
- The sample mean is represented by a symbol.
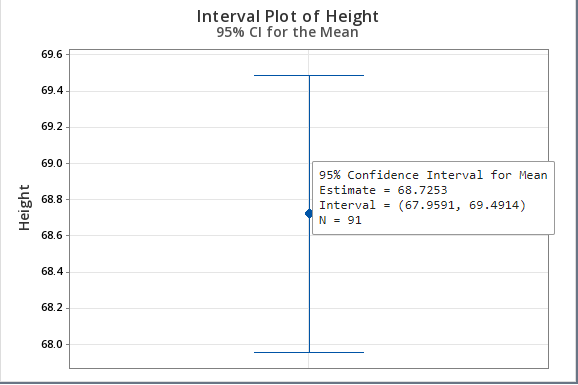
Investigate confidence intervals that are surprising or unexpected. For example, if a confidence interval for the mean of a sample of customer wait times is substantially different from the confidence intervals of previous samples, you should try to determine the cause of the difference.
Sample size (n)
The sample size can affect the appearance of the graph.
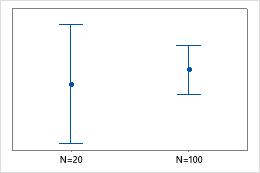
Usually, the larger the sample size, the smaller and more precise the confidence interval. If the confidence interval is too wide, try to collect a larger sample. Large differences in sample sizes between groups (or multiple Y variables) can affect the widths of the intervals, and may produce misleading results. If sample sizes for the groups (or multiple Y variables) are approximately the same, you can be more confident that differences in the widths of the intervals is primarily due to differences in variation.
Step 2: Assess and compare groups
If your interval plot has groups, assess and compare the center and spread of groups.
Centers
Determine whether any confidence intervals overlap. If the intervals for two means do not overlap, the population means may be statistically significant.
For example, in the first interval plot, the first and second intervals overlap with each other, but they do not overlap with the third interval. Therefore, the mean of the third group could be significantly different than the means of the other two groups. In the second interval plot, the intervals do not overlap. Therefore, the differences in means could be statistically significant.
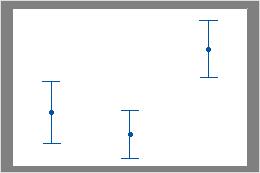
Some intervals overlap
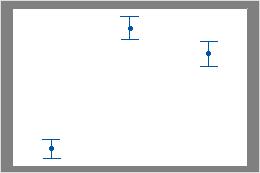
No intervals overlap
- Use a 2-sample t test if you have only two groups.
- Use a one-way ANOVA if you have three or more groups.
Spreads
Look for differences between the spreads of the groups.
The intervals in this plot have similar centers but different spreads.
Tip
To determine whether a difference in interval width is caused by a difference in sample variation or a difference in sample size, double-click on an interval. On the Options tab, click Pool error across groups. This recreates the intervals using the pooled standard deviation instead of the individual standard deviations. Any difference in widths you see now are strictly due to different sample sizes.
- Use a 2 variances test if you have only two groups.
- Use a test for equal variances if you have three or more groups.