In Graph variables, enter one or more numeric or date/time columns that you want to graph. By default, Minitab creates a separate graph for each variable.
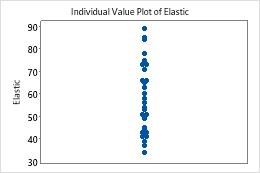
In this worksheet, Elastic is the graph variable. The graph shows the individual elastic values.