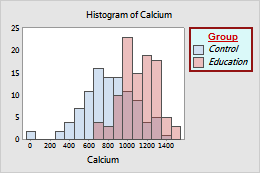
Legends identify the different groups of data on the graph. Tables include statistical information for the graph variables.
Some graphs have a legend or a table. For example, the following probability plot has both a legend and a table. 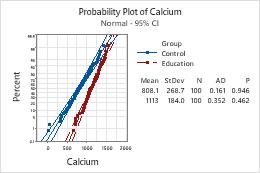
- Legend
-
The legend identifies the visual elements used to distinguish different groups of data on the graph. The legend helps you evaluate the effects of grouping. For example, the legend in the preceding graph shows the attributes of the symbols and connect lines used to represent the Control and Education groups.
- Table
- The table includes statistical information for the variables that are graphed.
Change the location and size of the legend or table
When you are editing a graph, you can drag the legend or table to a different location. You can also drag a corner or an edge of the legend or table to change its size.
To specify the location and size of the legend or table, use the following steps:
- Double-click the graph to open the Options pane. The Options pane provides a subset of the possible graph editing options.
- Select More Options to open the Edit Graph dialog box and access all the graph editing options.
- Double-click the legend or table to open the Edit Legend or Edit Table dialog box.
- On the Location tab, specify the location relative to the figure region.
For example, on the following scatterplot, the legend is located at X minimum = 0.8038, X maximum = 0.9923, Y minimum = 0.1264, Y maximum = 0.3448. 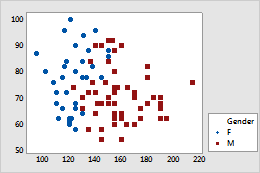
Hide rows or columns in a legend or table
To hide individual rows or columns of text on the legend or table, use the following steps:
- Double-click the graph to open the Options pane. The Options pane provides a subset of the possible graph editing options.
- Select More Options to open the Edit Graph dialog box and access all the graph editing options.
- Select an individual row or column in the table or legend with a single-click and press Delete.
- Then choose to hide the row or column.
Note
Note, to delete the entire table, just select it and press Delete.
Change the text in a legend or table
To change or delete the labels, use the following steps:
- Double-click the graph to open the Options pane. The Options pane provides a subset of the possible graph editing options.
- Select More Options to open the Edit Graph dialog box and access all the graph editing options.
- Select the label in the table or legend and double-click to open the Edit Text dialog box.
- Then make changes.
Note
Note, you can only make changes to the labels, not the calculated numeric values.
Change the text, font, and attributes of the legend or table
To change any text on the legend or table, use the following steps:
- Double-click the graph to open the Options pane. The Options pane provides a subset of the possible graph editing options.
- Select More Options to open the Edit Graph dialog box and access all the graph editing options.
- Double-click the legend or table to open the Edit Legend or Edit Table dialog box.
- Select the tab to make the edits that you want.
- On the Attributes tab, change the fill pattern, border lines, and fill lines.
- On the Header Font tab, change the characteristics of the font of the legend or the table title, if there is one.
- On the Body Font tab, change the characteristics of the font of the legend or the table body text.
For example, the following histogram has a customized legend.