About crosshairs
Crosshairs are a tool that displays the x- and y-values of any point on a graph, such as on a scatterplot. As you move the mouse pointer, the crosshairs location and coordinates update. Crosshairs are a quick and easy way to explore data on your graph.
For the 3-dimensional contour plot, crosshairs display x-, y-, and z-values.
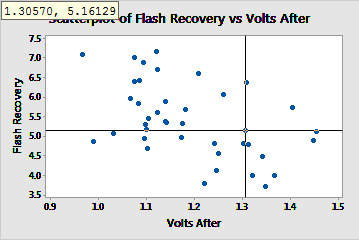
Example of crosshairs
In this example, the crosshairs are at x = 1.30570 and y = 5.16129. These coordinates appear in the upper left corner of the graph.
Display crosshairs
You can display crosshairs when you create a graph that has x and y scales, including categorical scales. Crosshairs are not available on the pie chart, dot plot, marginal plot, 3D scatterplot, or 3D surface plot.
- Double-click the graph.
-
Right-click the graph and choose
Crosshairs.
Tip
You can use crosshairs to provide exact locations for users to insert annotations, such as polylines, on a graph. For more information, go to Annotation shapes, text, and markers.
About flags on contour plots
A flag is at type of graph annotation that displays the precise x-, y-, and z-values for any point on a contour plot. Use a flag to determine the response value for a specific combination of factor or component levels. Flags are permanent annotations on the graph; therefore, they are useful for reports and presentations.
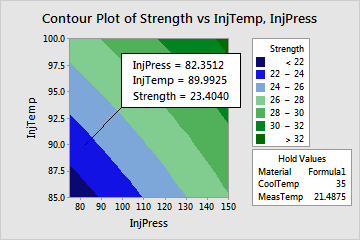
Example of a flag
This contour plot shows the effect of injection temperature and injection pressure on the strength of insulation. A flag identifies a particular point on the graph.
Plant a flag
You can plant a flag at any point on a contour plot.
- Double-click a contour plot.
- Right-click the graph and choose Crosshairs.
- Use the crosshairs to find the exact coordinates, then click the location on the graph to plant the flag.
Edit a planted flag
After you plant a flag, you can edit it.
- Double-click the graph.
- Double-click the flag.
-
Select the tab to make the edits that you want.
- Attributes: Change the background that appears behind the text of the planted flag. This includes the type and color of the background, as well as the type, color, and size of the lines that form the border and the fill of the background.
- Font: Change the font, color, style, and size of the text of the planted flag.