A materials engineer for a building products manufacturer is developing a new insulation product. The engineer designs a 2-level full factorial experiment to assess several factors that could impact the strength, density, and insulating value of the insulation.
The engineer fits the factorial design model and then uses Factorial Plots to better understand the effects.
- Open the sample data, InsulationProperties_model.MWX.
- Choose .
- From Response, select Insulation.
- Under Variables to Include in Plots, move Material, InjTemp, and CoolTemp from the Available list to the Selected list.
- Click OK.
Interpret the results
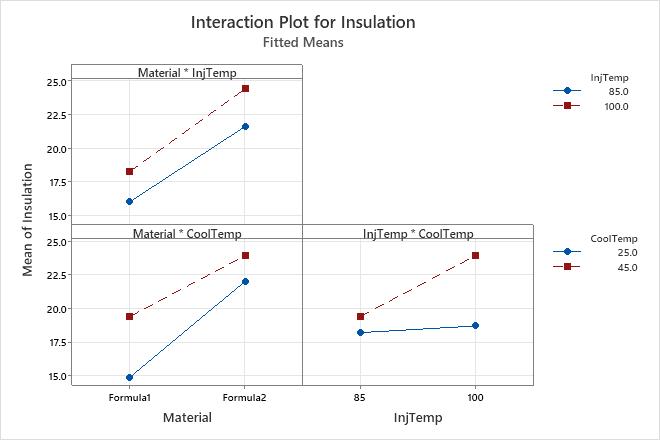
The interaction plot shows the fitted mean of the insulating value versus combinations of material, injection temperature, and cooling temperature. This plot shows apparent interaction effects because the lines are not all parallel, which implies that the relationship between insulating value and each factor depends on the setting of another factor. The results of Analyze Factorial Design indicate that the interaction effects for Material*CoolTemp and InjTemp*CoolTemp are statistically significant.
The plot for the Material*CoolTemp interaction shows that the effect of cooling temperature on insulation is greater for Formula1 than for Formula2.
The relationship between insulating value and the injection temperature depends on the cooling temperature. When the product is manufactured with InjTemp 85, the insulating value is nearly equal for both cooling temperatures. However, with InjTemp 100, the cooling temperature is associated with substantially different insulating values. InjTemp 100 and CoolTemp45 are associated with the highest insulating values.
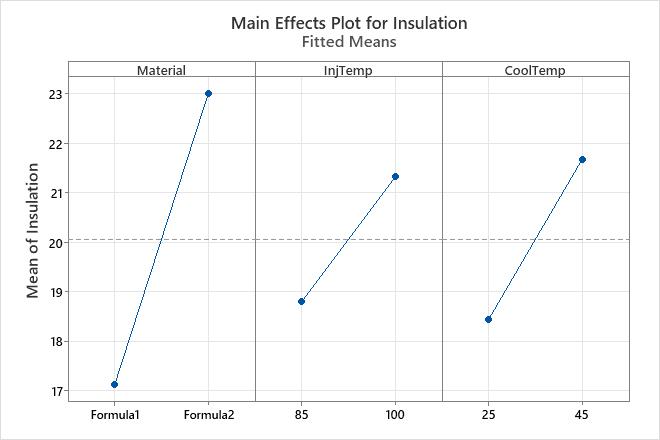
The main effects plots show the fitted means for each level of each categorical variable. Because the lines are not horizontal, main effects are present for all of these variables. The results of Analyze Factorial Design confirm that the main effects are all statistically significant. However, because the interaction effects are statistically significant, the main effects plot can be misleading. Consequently, you cannot interpret the main effects without considering the interaction effects.