A manager at a food packing company wants to monitor the number of overfilled containers for each of the packing machines. The manager counts the number of overfilled containers per machine on the same day.
To determine whether some machines overfill at different rates than other machines, the manager uses analysis of means for Poisson data.
- Open the sample data, Packing.MWX.
- Choose .
- In Response, enter Overfilled.
- Under Distribution of Data, select Poisson.
- Click OK.
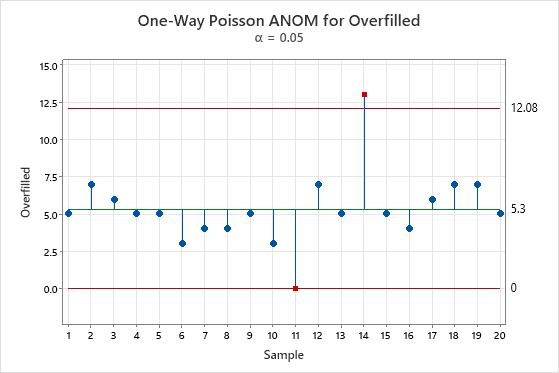
Interpret the results
In this plot, the 11th machine has an overfill count of 0, which is unusually small. The 14th machine has an overfill count of 13, which is unusually large. The manager schedules diagnostic work for the 14th machine to rule out any mechanical problems.