A quality engineer for an automotive supply company wants to decrease the number of car door panels that are rejected because of paint flaws.
The engineer wants to determine whether a relationship exists between the type of paint flaws and the shift during which the door panels are made.
- Open the sample data, PaintFlaws.MWX.
- Choose .
- In Defects or attribute data in, enter Flaws.
- In BY variable in, enter Shift.
- Select Default (all on one graph, same ordering of bars).
- Select Combine remaining defects into one category after this percent, and enter 95.
- Click OK.
Interpret the results
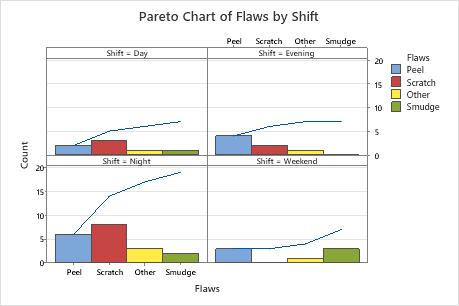
In this example, the chart shows that most of the flaws are from Peels and Scratches, and the night shift produces the most flaws overall. The engineer should investigate why these defects are most common during the night shift.