The director of quality for a group of hospitals wants to assess the medication error rate. Examples of errors include delivering medication at the wrong time, delivering the wrong dose, and delivering the wrong medication. The director records the number of patients and the number of medication errors each week for 32 weeks.
The number of patients is high, the average subgroup size is more than 7500, and the data exhibit overdispersion. So the director decides to use a Laney U' chart instead of a traditional U chart to monitor medication errors.
- Open the sample data, MedicationErrors.MWX.
- Choose .
- In Variables, enter Errors.
- In Subgroup sizes, enter Patients.
- Click U′ Options.
- On the Tests tab, select 1 point > K standard deviations from center line (Test 1) and K points in a row on same side of center line (Test 2).If you are not sure which tests apply in your specific situation, use Tests 1 and 2 when you first establish the control limits based on your data.
- Click OK in each dialog box.
Interpret the results
Because the sample sizes are unequal, the control limits vary. The Sigma Z value (approximately 5.5) is greater than 1, which indicates that the control limits on the Laney U' chart are wider than those on a traditional U chart to adjust for overdispersion. Subgroup 23 failed test 1, so the director concludes that the rate of medication errors is not in control.
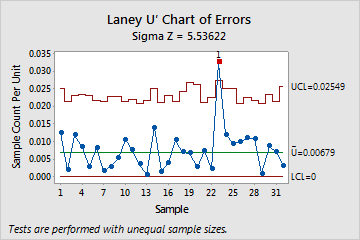
Test Results for Laney U′ Chart of Errors
| TEST 1. One point more than 3.00 standard deviations from center line. |
|---|
| Test Failed at points: 23 |