An engine manufacturer uses a forging process to make piston rings. The quality engineers want to assess the process capability. They collect 25 subgroups of five piston rings and measure the diameters. The specification limits for piston ring diameter are 74.0 mm ± 0.05 mm.
The engineers perform normal capability sixpack to check the assumptions for normal capability analysis and to evaluate how well the diameters of the piston rings meet the requirements.
- Open the sample data, PistonRingDiameter.MWX.
- Choose .
- In Single column, enter Diameter.
- In Subgroup size, enter 5.
- In Lower spec, enter 73.95.
- In Upper spec, enter 74.05.
- Click Options.
- In Target (adds Cpm to table), enter 74.
- Click OK in each dialog box.
Interpret the results
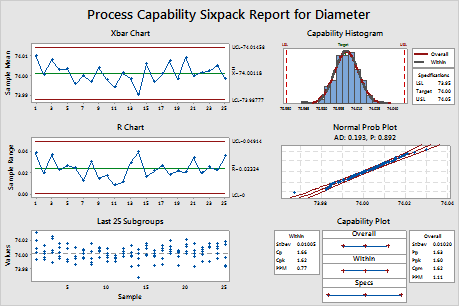
The Xbar and R charts indicate that the process is stable, with no points beyond the control limits. The Last 25 Subgroups plot indicates the data are randomly and symmetrically distributed around the process mean. The normal probability plot indicates that data are normally distributed. Therefore, the assumptions for normal capability analysis are satisfied and the capability of the process can be analyzed.
The histogram and capability indices indicate that the process is approximately centered on the target and the measurements are within the specification limits. The capability indices Cpk, Ppk, and Cpm are all greater than 1.33, which is a generally accepted minimum value for a capable process. Therefore, the engineers conclude that the forging process satisfies customer requirements for the diameters of the piston rings.