Use the t-distribution to analyze the mean of an approximately normal population when the population standard deviation is unknown. For example, one use of the t-distribution is to test whether a population mean and a hypothesized mean are different. Tests of significance for regression coefficients also use the t-distribution.
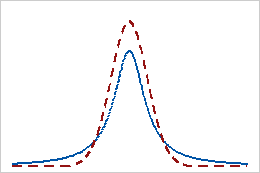
The t-distribution is a continuous distribution that is specified by the number of degrees of freedom. It is a symmetric, bell-shaped distribution that is similar to the normal distribution, but with thicker tails. For example, the following graph illustrates t-distributions with different degrees of freedom. The solid-line t-distribution has 1 degree of freedom. The dashed-line t-distribution has 100 degrees of freedom.