You can calculate values for probability density functions, cumulative distribution functions, or inverse cumulative probabilities of your data, for the distribution you choose from the menu.
- Probability distribution function (PDF)
- The probability distribution function (PDF) curve indicates regions of higher and lower probabilities for values of the random variable. For example, for a normal distribution, the highest PDF value is at the mean, while lower PDF values are in the tails of the distribution.
- Cumulative distribution function (CDF)
- The cumulative distribution function (CDF) calculates the cumulative probability up to the variable value that you specify. Use the CDF to determine the probability that a random observation that is taken from the population will be less than or equal to a certain value. For example, a cumulative distribution function can show the proportion of trees in a forest that have diameter measurements of 10 inches or less.
- Inverse cumulative distribution function (ICDF)
- The inverse cumulative distribution function (ICDF) gives the value of the variable associated with a specific cumulative probability. For example, a reliability engineer wants to determine the time by which specific proportions of components fail. The engineer can use the ICDF to determine the 95th percentile of the failure time distribution.
Examples for the continuous distributions
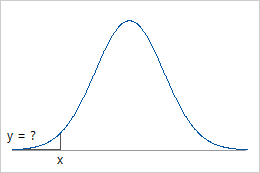
Use PDF when you know x and want the corresponding y-value on the curve.
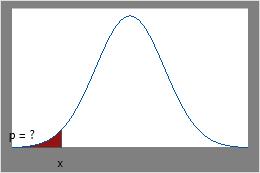
CDF
Use CDF when you know x and want the area under the curve.

ICDF
Use ICDF when you know the cumulative area under the curve and want the x-value.