Ways to modify the size of a graph
- Double-click the graph.
- Double-click the graph region or figure region to open the Edit Graph and Figure Regions dialog box.
- On the Graph Size tab, select the size settings that you want to use.
To change the size for all subsequent graphs, choose and specify the new default size.
About the aspect ratio
The aspect ratio is the ratio formed when comparing the dimensions of a geometric figure. For example, a square's width and height are equal, so its aspect ratio is 1:1. In Minitab, the data regions of many graphs have an aspect ratio of 1.5:1, meaning that they are one and a half times as wide as they are tall.
You can change an aspect ratio by modifying the length of each side of the graph. Changes to the aspect ratio of a graph should be informed by process knowledge. Lengthening one axis relative to the other accentuates changes that occur in that direction. Shortening one axis relative to the other minimizes changes that occur in that direction. These adjustments can serve to better support and illustrate your data, but used incorrectly, they can misrepresent it as well.
Example of changing the aspect ratio
Numerous products that are sold by weight were purchased from a grocery store. The following scatterplots represent the relationship between the fill weight reported on packages and the actual weight of the product.
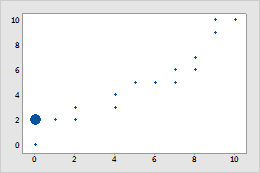
Graph with an aspect ratio of 1.5:1
The scales along the x and y axes have the same range of 0 to 10 pounds, but the axes are not equal. Because the scales represent equal ranges of similar units, you may want the axes to be equal.
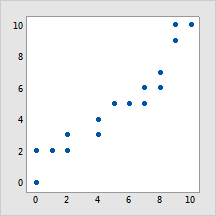
Graph with an aspect ratio of 1:1
An aspect ratio of 1:1 shows that the axes are equal: a change of one pound on either axis would move a point the same distance.
Change a rectangular graph to a square graph (aspect ratio of 1:1)
- Double-click the graph.
- Double-click the graph outside the data region to open the Edit Graph and Figure Regions dialog box.
- On the Graph Size tab, under Size (inches), choose Custom.
- Enter the same number for Width and Height. For example, enter 8 for both. Click OK.
- Double-click the data region of the graph to open the Edit Data Region dialog box.
- On the Location tab, choose Custom.
- Enter the same X-minimum and Y-minimum, for example, 0.1. Enter the same X-maximum and Y-maximum, for example, 0.9. The values must be between 0 and 1.