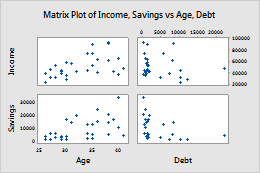
Choose data display elements for Scatterplot and Matrix Plot
The following images show the elements that you can display on a scatterplot or a matrix plot. To select elements when you create the graph, click Data View.
To add or remove elements after you create the graph, use the following steps:
- Double-click the graph.
- Right-click the graph and choose .

Symbols (default)
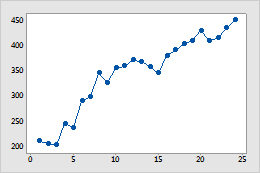
Connect line
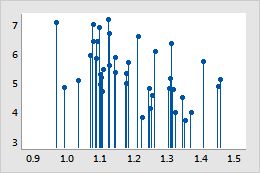
Project lines
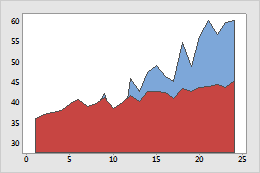
Area
Note
For information on editing the data display elements, go to the following topics.
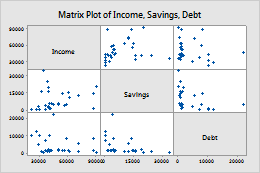
Choose which portions of the matrix to display for Matrix Plot
By default, when you create a matrix of plots, Minitab displays both the lower left portion of the matrix and the upper right portion. The two portions display the same data with the axes reversed. For example, variables that appear on the x-axis in the lower left portion of the matrix appear on the y-axis in the upper right portion. To choose which portions to display when you create the graph, click Matrix Options. To change which portions are displayed on an existing graph, use the following steps:
- Double-click the graph.
- Right-click the graph and choose .
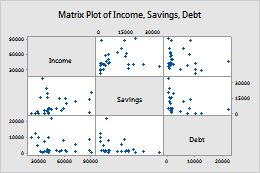
Full (default)
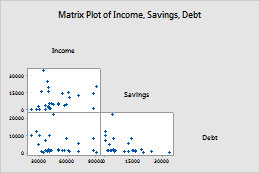
Lower left
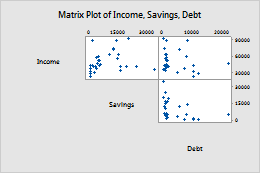
Upper right
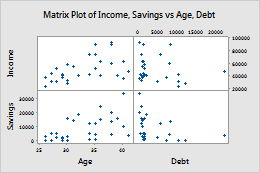
Choose where to display the variable names for Matrix Plot
By default, Minitab displays the axis labels in the middle of the matrix of plots. To display the axis labels along the border of the matrix when you create the plot, click Matrix Options.
To change where the axis labels are displayed on an existing graph, use the following steps:
- Double-click the graph.
- Right-click the graph and choose .
Diagonal (default)
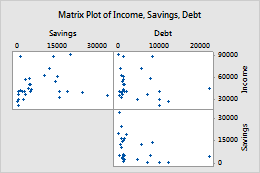
Boundary
Choose where to display tick marks for Matrix Plot
By default, Minitab displays tick marks on alternate sides of the matrix of plots. To display all tick marks on the same side of the matrix, use the following steps:
- Double-click the graph.
- Right-click the graph and choose .
Note
This option is not available if you display only the lower left or upper right portion of the matrix.
Alternate (default)
Don’t alternate
Display margins between the plots for Matrix Plot
To add margins between the individual plots, use the following steps:
- Double-click the graph.
- Right-click the graph and choose .
Margins between plots = 0 (default)