Download the Macro
Be sure that Minitab knows where to find your downloaded macro. Choose . Under Macro location browse to the location where you save macro files.
Important
If you use an older web browser, when you click the Download button, the file may open in Quicktime, which shares the .mac file extension with Minitab macros. To save the macro, right-click the Download button and choose Save target as.
Required Inputs
You need up to five design matrices.
Optional Inputs
- MODEL model type
- Specifies the model to be tested when running the experiment. The
default is "interaction." You can enter multiple models, such as linear,
quadratic, interaction, purequadratic. Each model includes the following terms:
- Linear: constant and linear terms
- Interaction: constant, linear, and cross product terms
- Quadratic: interactions plus squared terms
- Purequadratic: constant, linear and squared terms
- RESOLUTION K
- Use to specify the number of sampled design points used to estimate the minimum, maximum, and integrated prediction variance at each distinct value of the radius. For rotatable designs you can select a small resolution. For non-rotatable designs you may need to increase the resolution as the number of factors increases. The default is 500 design points.
- INCREMENT K
- Use to specify the radius increment. You can change this value to display the graph with a larger or smaller resolution. The default value is 0.1 coded units.
- MAXDIST K
- Indicates the maximum radius distance. By default, this is defined as the largest distance to the design point that is farthest away from the center of the design. For a VDG that is based on multiple designs, the MAXDIST is set as the largest distance from all the designs.
Running the Macro
Suppose the factors of a CCD have been copied to a matrix M1, and the factors of a Box-Behnken design has been stored in M2. To run the macro, choose and type:
%VDG M1 M2;
MODEL "quadratic";
RESOLUTION 150.
Click Run.
More Information
Variance Dispersion Graphs and Design of Experiments
Variance dispersion graphs are graphical tools used in the process of selecting a design of experiment (DOE). These graphs show the scaled prediction variance of a DOE across the design space and are typically used to compare response surface designs. However, variance dispersion graphs can also be used to compare the performance of multiple designs for a specific model, such as a linear model, a linear model with interaction terms, a linear model with quadratic terms, or a full quadratic model.
History and Background of VDG
The VDG was originally developed by Giovannitti-Jensen and Myers (1989) and Myers et al. (1992) to display a snapshot of the stability of the scaled prediction variance across the design space.
Mathematically, the scaled prediction variance can be estimated with the equation below:

where v(x) is the scaled prediction variance at the point x and, as shown above, does not depend on the response data, only on the design matrix X. In other words, the scaled prediction variance is a function of the number of runs in your experiment, the covariance matrix, and the point at which you are evaluating the prediction variance. Because the scale prediction variance displayed by the VDG is independent of the response data, the VDG allows you to assess the goodness of a design a priori.
In general, a VDG is constructed with four basic components:
- · A plot of the spherical variance against the radius r. The spherical variance is v(x) averaged (integrated) over the surface of a sphere of radius r.
- · A plot of the maximum prediction variance on a radius r for multiple values of r starting from the origin (r starts at zero and then takes small increment steps until reaching the design point that is the farthest away from the origin).
- · A plot of the minimum prediction variance on a radius r for multiple values of r starting from the origin.
- · A horizontal line at v(x) = p, where p is the number of parameters in the model to be fitted. An "optimal" design would have the maximum prediction variance be less than or equal to p for all points in the design space.
The VDG shows the average, the maximum, and the minimum scaled prediction variances at different values of r, which represents the distance of any given point to the origin or center of the design.
Using a VDG to Evaluate Other Aspects of a Design
Using a VDG, you can evaluate the performance of a single design in terms of its prediction variance. You can also use the VDG to compare two or more designs. Another application of a VDG is to evaluate the effect of adding center points to a design.
You can also use a VDG to assess whether a design is rotatable. In a rotatable design, all three lines (minimum, average and maximum) in the graph will coincide. If the minimum, average, and maximum lines do not coincide, the face centered design is not rotatable.
Monte Carlo Simulation to Estimate Prediction Variance
This advanced section describes the mathematical methods used to estimate the minimum, maximum, and average prediction variances displayed in a VDG. If you are interested only in how to run a macro to display and interpret a VDG you may want to skip this section.
As mentioned previously, for a fixed value of the radius, a search needs to be performed to find the minimum, maximum, and integrated scaled prediction variance. The method selected for the Minitab macro is based on Monte Carlo simulation and the ability to search uniformly at equidistant points from the center x = (0,0,…,0)T of the design.
Three quantities need to be calculated at different distances from the origin: 1) the minimum prediction variance, 2) the maximum prediction variance, and 3) the integrated prediction variance. There are multiple ways to find these quantities. One method is by using a nonlinear programming algorithm to find the minimum and maximum prediction variance. However, the method we have chosen to estimate these quantities is by uniformly sampling and finding a large set of distinct points that are the same distance from the center of the design for different values of r. From the space of equidistant points, one can guarantee the proper estimation of the minimum and maximum prediction variances by having two conditions satisfied: First, the sampling of equidistant points needs to be uniform. In other words, there can‟t be regions where some equidistant points are more likely to be chosen than others. Second, the number of points needs to be large enough to cover the whole space of possible design points.
Because all the points that need to be sampled are equidistant, the problem of sampling is equivalent to finding a good way of obtaining points from an n-ball or hypersphere for a given radius.
The procedure is described in Marsaglia (1972) and summarized below:
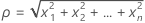
- Generate an n-dimensional vector of normal random variables (e.g. from a standard normal distribution). Let this vector be x = (x1, x2,…,xn). Create multiple vectors x.
- Calculate the radius ρ for
all the points x you have generated.
- Transform each one of the original design points obtained in step 1 by multiplying each entry of the vector x by r, where r represents the radius of the hypersphere you are sampling from.
We have illustrated how to sample points in a hypersphere of constant radius r. We can use this sampling technique to estimate the maximum or minimum prediction variance. Using these samples, from the Weak Law of Large Numbers, the average prediction variance of the sampled design points can be used to estimate the true integrated prediction variance as long as n is large.
References
[1] Marsaglia G. "Choosing a Point from the Surface of a Sphere". The Annals of Mathematical Statistics, Vol. 43, No. 2 (1972), pp. 645-646.
[2] Myers R, Montgomery D. (2002). Response Surface Methodology - Process and Product Optimization Using Designed Experiments, Second Edition. John Wiley & Sons, Inc.