An engineer for a vision care company tests a new cleaning solution for contact lenses. The engineer wants to verify that the new solution cleans lenses as well as the leading brand. The engineer has 14 participants wear contact lenses for a day, and then clean the lenses. Each participant cleans one lens in the new solution and the other lens in the leading brand. The engineer assesses the cleanliness of each lens by measuring the angle of contact for a drop of fluid on the lens. The angle of contact is affected by film or deposits on the lens. To be equivalent, the mean angle for the new solution should be within ±0.5 degrees of the mean angle of the leading brand.
Before the engineer collects the data for the equivalence test with paired data, she uses a power and sample size calculation to determine whether a sample size of 14 provides adequate power for the test. From previous samples, the engineer estimates the standard deviation of the population is 0.42.
- Choose .
- From Hypothesis about, select Test mean - reference mean (Difference).
- From What do you want to determine? (Alternative hypothesis), select Lower limit < test mean - reference mean < upper limit.
- In Lower limit, enter -0.5. In Upper limit, enter 0.5.
- In Sample sizes, enter 14.
- In Differences (within the limits), enter 0.1 0.2 0.3 0.4.
- In Standard deviation of paired differences, enter 0.42.
- Click OK.
Interpret the results
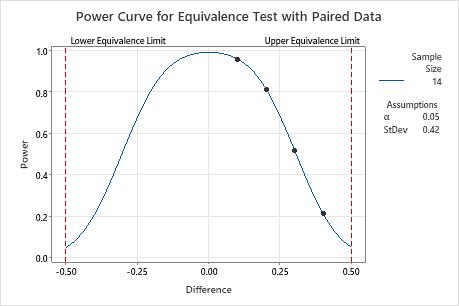
If the difference is 0.1 and the engineer uses a sample size of 14 pairs of observations, then the power of the test is greater than 0.9. If the difference is 0.2 and the engineer uses a sample size of 14 pairs of observations, then the test has a power over 0.8. However, if the difference is 0.3, and the engineer uses a sample size of 14 pairs of observations, then the test has a power of approximately 0.52, which is not adequate.
When the difference is closer to the upper equivalence limit (0.5), the power of the test is lower. For example, for a difference of 0.4, if the engineer uses a sample size of 14 pairs of observations, then the test has a power of approximately 0.22.
For any sample size, as the difference approaches the lower equivalence limit or the upper equivalence limit, the power of the test decreases and approaches α (alpha, which is the risk of claiming equivalence when it is not true).
Method
| Power for difference: | Test mean - reference mean |
|---|---|
| Null hypothesis: | Difference ≤ -0.5 or Difference ≥ 0.5 |
| Alternative hypothesis: | -0.5 < Difference < 0.5 |
| α level: | 0.05 |
Results
| Difference | Sample Size | Power |
|---|---|---|
| 0.1 | 14 | 0.957371 |
| 0.2 | 14 | 0.811858 |
| 0.3 | 14 | 0.517255 |
| 0.4 | 14 | 0.211869 |