Type of CUSUM
- Tabular
- Select this option to generate two tabular CUSUMs. Use the upper CUSUM to detect upward shifts in the level of the process and the lower CUSUM to detect downward shifts. This chart uses a UCL and a LCL to determine when a process is out of control. See Page1 and Prins et al. 2 for a discussion of tabular CUSUMs.
- Use FIR: Select to use the FIR (fast initial response) method to initialize the tabular CUSUM.
- Number of standard deviations: Enter the number of standard deviations above and below the center line. Normally, tabular CUSUMs are initialized at 0, but if the process is out of control at startup, the CUSUMs will not detect the situation for several subgroups. The FIR method has been shown by Lucas3 to reduce the number of subgroups needed to detect problems at startup.
- Reset after each signal: Select this option to reset the CUSUMs to their initial values whenever an out-of-control signal is generated. When a process goes out of control, try to find and eliminate the cause of the problem. After you correct the problem, reset the CUSUMs to their initial values.
- Use FIR: Select to use the FIR (fast initial response) method to initialize the tabular CUSUM.
- V-mask
- Generate a single V-mask CUSUM that uses a V-mask to determine when a process is out of control. See Lucas3 and Vargas4 for a discussion of the V-mask chart.
- Center on subgroup: Enter a subgroup number on which to center the V-mask. If you don't enter a value, then Minitab centers the V-mask on the last subgroup.
CUSUM Plan
Select h and k from ARL (Average Run Length) tables. See Lucas5 and Lucas et al.6
- h
- Enter a value that is greater than 0 for h. For tabular CUSUMs, h is the number of standard deviations between the center line and the control limits. For V-mask CUSUMs, Minitab calculates the half-width of the V-mask (H) at the point of origination by H = h * s.
- k
- Enter a value that is greater than 0 for k. For tabular CUSUMs, k is the allowable slack in the process. For V-mask CUSUMs, k is the slope of the V-mask arms.
Force control limits to be straight
When the subgroup sizes differ, the control limits or V-mask are uneven, but you can force them to be straight. The following control charts display the same data.
- Using actual sizes of the subgroups
-
By default, Minitab calculates the control limits or V-mask using the actual subgroup sizes.
This tabular CUSUM chart uses the actual sizes of the subgroups, so the control limits are uneven.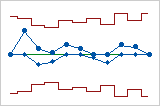 This V-mask CUSUM chart uses the actual sizes of subgroups, so the V-mask is uneven.
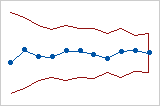
- Assuming all subgroups have size
-
Under When subgroup sizes are unequal, calculate control limits/V-mask, select Assuming all subgroups have size, and enter a subgroup size. This option is especially useful when all subgroups were intended to be the same size, but some subgroups are a different size. For example, some subgroups are smaller because of missed measurements. In that case, set the subgroup size to the intended size.
This tabular CUSUM chart uses a specified subgroup size, so the control limits are even.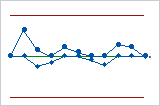 This V-mask CUSUM chart uses a specified subgroup size, so the V-mask is even.
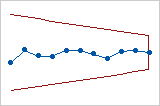
1 E.S. Page (1961). "Cumulative Sum Charts," Technometrics, 3, 1−9.
2 J. Prins and D. Mader (1997−98). "Multivariate Control Charts for Grouped and Individual Observations," Quality Engineering , 10, 49−57.
3 J.M. Lucas (1976). "The Design and Use of V-Mask Control Schemes," Journal of Quality Technology , 8, 1−12.
4 Vargas N., J. A. (2003). "Robust Estimation in Multivariate Control Charts for Individual Observations," Journal of Quality Technology , 35, 367−376.
5 J.M. Lucas (1976). "The Design and Use of V-Mask Control Schemes," Journal of Quality Technology , 8, 1−12.
6 J.M. Lucas and R.B. Crosier (1982). "Fast Initial Response for CUSUM Quality-Control Schemes: Give Your CUSUM a Head Start," Technometrics, 24, 199−205.