Test statistic
- Minitab ranks the two combined samples. Minitab gives the smallest observation rank 1, the second smallest observation rank 2, and so on.
- If two or more observations are tied, Minitab assigns the average rank to both observations.
- Minitab sums the ranks of the first sample.
Ranking tied values
- Sort the observations in ascending order.
- Assign ranks to each observation as if there were no ties.
- For a tied set, take the average of the corresponding ranks and assign this value as the new rank to each tied value in that set.
Example
A sample has 9 observations: 2.4, 5.3, 2.4, 4.0, 1.2, 3.6, 4.0, 4.3, and 4.0.
| Observation | Rank
(assuming no ties) |
Rank | |
|---|---|---|---|
| 1.2 | 1 | 1 | |
| Tied | 2.4 | 2 | 2.5 |
| 2.4 | 3 | 2.5 | |
| 3.6 | 4 | 4 | |
| Tied | 4.0 | 5 | 6 |
| 4.0 | 6 | 6 | |
| 4.0 | 7 | 6 | |
| 4.3 | 8 | 8 | |
| 5.3 | 9 | 9 |
- The number of the set of ties is 2.
- The number of tied values that is in the 1st set is 2.
- The number of tied values that is in the 2nd set is 3.
P-value
Formula
The Mann-Whitney test uses a normal approximation method to determine the p-value of the test.
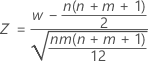 is approximately distributed as a normal distribution with a mean of 0 and a standard deviation of 1, N(0,1).
| Alternative hypothesis | P-value |
|---|---|
| H1: η1 > η2 | 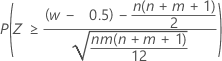 |
| H1: η1 < η2 | 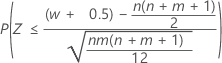 |
| H1: η1 ≠ η2 | 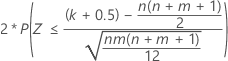 |
The adjusted p-value is usually more accurate than the unadjusted p-value. However, the unadjusted p-value is the more conservative estimate because it is always greater than the adjusted p-value for a specific pair of samples.
Notation
| Term | Description |
|---|---|
| W | Mann-Whitney test statistics |
| n | size of sample 1 |
| m | size of sample 2 |
| η1 | median of sample 1 |
| η2 | median of sample 2 |
| k |  |
| i | 1, 2, …, I |
| I | number of sets of ties |
| ti | number of tied values in the ith set of ties |
Point estimate
The approximation algorithm that Minitab uses to calculate the point estimate of η1 – η2is described in this article: J.W. McKean and T.A. Ryan, Jr. (1977). "An Algorithm for Obtaining Confidence Intervals and Point Estimates Based on Ranks in the Two Sample Location Problem", Transactions on Mathematical Software, 183–185.
Confidence interval
The confidence interval of η1 – η2 is defined as the range of values of η1 – η2 for which the null hypothesis is not rejected.
The method that Minitab uses to calculate the confidence interval is described in this article: J.W. McKean and T.A. Ryan, Jr. (1977). "An Algorithm for Obtaining Confidence Intervals and Point Estimates Based on Ranks in the Two Sample Location Problem", Transactions on Mathematical Software, pp.183-185.