Fitted line plot
The fitted line plot displays the response and predictor data. The plot includes the regression line, which represents the regression equation. You can also choose to display the 95% confidence and prediction intervals on the plot.
Interpretation
- The sample contains an adequate number of observations throughout the entire range of all the predictor values.
- The model properly fits any curvature in the data. If you fit a linear model and see curvature in the data, repeat the analysis and select the quadratic or cubic model. To determine which model is best, examine the plot and the goodness-of-fit statistics. Check the p-value for the terms in the model to make sure they are statistically significant, and apply process knowledge to evaluate practical significance.
- Look for any outliers, which can have a strong effect on the results. Try to identify the cause of any outliers. Correct any data entry or measurement errors. Consider removing data values that are associated with abnormal, one-time events (special causes). Then, repeat the analysis. For more information on detecting outliers, go to Unusual observations.
Regression equation
Use the regression equation to describe the relationship between the response and the terms in the model. The regression equation is an algebraic representation of the regression line. The regression equation for the linear model takes the following form: Y= b0 + b1x1. In the regression equation, Y is the response variable, b0 is the constant or intercept, b1 is the estimated coefficient for the linear term (also known as the slope of the line), and x1 is the value of the term.
The regression equation with more than one term takes the following form:
y = b0 + b1X1 + b2X2 + ... + bkXk
- y is the response variable
- b0 is the constant
- b1, b2, ..., bk are the coefficients
- X1, X2, ..., Xk are the values of the term
Equation coefficients
A regression coefficient describes the size and direction of the relationship between a predictor and the response variable. Coefficients are the numbers by which the values of the term are multiplied in a regression equation.
Interpretation
The coefficient of the term represents the change in the mean response for one-unit change in that term. The sign of the coefficient indicates the direction of the relationship between the term and the response. If the coefficient is negative, as the term increases, the mean value of the response decreases. If the coefficient is positive, as the term increases, the mean value of the response increases.
For example, a manager determines that an employee's score on a job skills test can be predicted using the regression model, y = 130 + 4.3x. In the equation, x is the hours of in-house training (from 0 to 20) and y is the test score. The coefficient, or slope, is 4.3, which indicates that, for every hour of training, the mean test score increases by 4.3 points.
The size of the coefficient is usually a good way to assess the practical significance of the effect that a term has on the response variable. However, the size of the coefficient does not indicate whether a term is statistically significant because the calculations for significance also consider the variation in the response data. To determine statistical significance, examine the p-value for the term.
95% CI
The confidence interval for the fit provides a range of likely values for the mean response given the specified settings of the predictors.
Interpretation
Use the confidence interval to assess the estimate of the fitted value for the observed values of the variables.
For example, with a 95% confidence level, you can be 95% confident that the confidence interval contains the population mean for the specified values of the variables in the model. The confidence interval helps you assess the practical significance of your results. Use your specialized knowledge to determine whether the confidence interval includes values that have practical significance for your situation. A wide confidence interval indicates that you can be less confident about the mean of future values. If the interval is too wide to be useful, consider increasing your sample size.
95% PI
The prediction interval is a range that is likely to contain a single future response for a value of the predictor variable.
Interpretation
With 95% prediction bands, you can be 95% confident that new observations will fall within the interval indicated by the purple lines. (Note, however, that this is only true for density values that are within the range included in the analysis.)
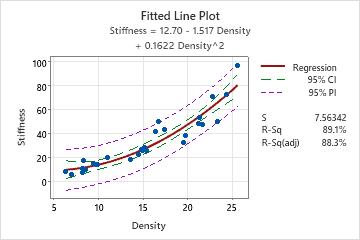
For example, a materials engineer at a furniture manufacturer develops a simple regression model to predict the stiffness of particleboard from the density of the board. The engineer verifies that the model meets the assumptions of the analysis. Then, the analyst uses the model to predict the stiffness.
The regression equation predicts that the stiffness for a new observation with a density of 20 is 12.70 – 1.517*20 + 0.1622*202, or 47.24. Although such an observation is unlikely to have a stiffness of exactly 47.24, the prediction interval indicates that the engineer can be 95% confident that the actual value will be between approximately 31 and 63.
The prediction interval is always wider than the corresponding confidence interval. In this example, the 95% confidence interval indicates that the engineer can be 95% confident that the mean stiffness will be between approximately 43 and 50.