Note
This command is available with the Predictive Analytics Module. Click here for more information about how to activate the module.
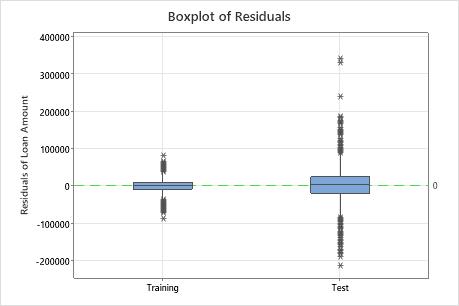
The boxplot shows the difference between the actual and fitted values. Points that are more than 1.5 times the interquartile range from the nearest quartile have individual symbols.
Interpretation
Ideally, the residuals are all close to 0, relative to the scale of the response variable. When you use a validation technique, Minitab creates separate plots for the training and test data. You can compare the plots to examine the relative performance of the model on the training data and on new data. You can also look for different patterns that could indicate a difference to investigate between the training and test data.
These boxplots show that the IQR is much larger for the test data set than for the training data set. This difference suggests that the performance of the model on new data is not as good as the performance of the model on the training data. Also, the large residuals, which are represented by individual symbols, can indicate that the model does not fit all of the data well.