Note
This command is available with the Predictive Analytics Module. Click here for more information about how to activate the module.
Important predictors
- Find the reduction in mean squared errors when the predictor splits a node.
- Add all the reductions from all the nodes where the predictor is the node splitter.
Then, the importance score for the predictor equals the sum of the model improvement scores across all the trees.

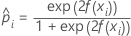
Average –loglikelihood for a binary response
Training data or no validation

where

Notation for training data or no validation
| Term | Description |
|---|---|
| N | sample size of the full or training data set |
| wi | weight for the ith observation in the full or training data set |
| yi | ith response value that is 1 for the event and 0 otherwise for the full or training data set |
 | predicted probability of the event for the ith row in the full or training data set |
 | fitted value from the model |
K-fold cross-validation
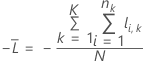
where

Notation for k-fold cross-validation
| Term | Description |
|---|---|
| N | sample size of the full or training data |
| nk | sample size of fold k |
| wi, k | weight for the ith observation in fold k |
| yi, k | binary response value of case i in fold k. yi, k = 1 for event class, and 0 otherwise. |
 | predicted probability for case i in fold k. The predicted probability is from the model that does not use the data in fold k. |
 | fitted value for case i in fold k. The fitted value is from the model that does not use the data in fold k. |
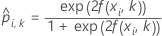
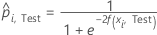
Test data set
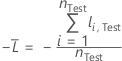
where

Notation for test data set
| Term | Description |
|---|---|
| nTest | sample size of the test data set |
| wi, Test | weight for the ith observation in the test data set |
| yi, Test | binary response value of case i in fold k in the test data set. yi, k = 1 for event class, and 0 otherwise. |
 | predicted probability for case i in the test data set |
 | fitted value for case i in the test data set |
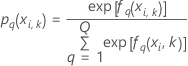
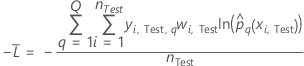
Average –loglikelihood for a multinomial response
 is the number of levels in the response variable.
Training data or no validation
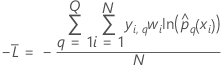
where
Notation for training data or no validation
| Term | Description |
|---|---|
 | sample size of the full or training data set |
| wi | weight for the ith observation in the full or training data set |
| yi, q | ith response value that is 1 when
 and 0 otherwise
 |
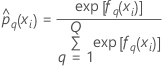
 | predicted probability of the qth level of the response for the ith row in the full or training data set |
 | fitted value from the qth sequence of trees for the ith row, which is used to calculate the predicted probability of the qth level of the response |
K-fold cross validation
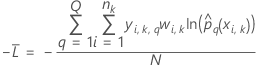
where
Notation for k-fold cross-validation
| Term | Description |
|---|---|
| N | sample size of the training data |
| nk | sample size of fold k |
| wi, k | weight for the ith observation in fold k |
| yi, k, q | ith response value of case
i in fold
k that is 1 when  and 0 otherwise.
 |
 | The predicted probability of the qth level of the response for the ith row in fold k. The predicted probability is from the model that does not use the data in fold k. |
 | The fitted value from the qth sequence of trees for the ith row in fold k, which is used to calculate the predicted probability of the qth level of the response. The fitted value is from the model that does not use the data in fold k. |
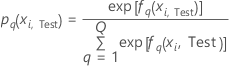
Test data set
where
Notation for test data set
| Term | Description |
|---|---|
| nTest | sample size of the test data |
| wi, Test | weight for the ith observation in the test data |
| yi, Test, q | ith response value of
case
i in the test data set that is 1 when
 and 0 otherwise.
 |
 | The predicted probability of the qth level of the response for the ith row in the test data. The predicted probability is from the model that does not use the test data. |
 | The fitted value for the qth sequence of trees for the ith row in the test data, which is used to calculate the predicted probability of the qth level of the response. The predicted probability is from the model that does not use the test data. |
Area under ROC curve
Formula


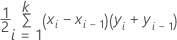
where k is the number of distinct event probabilities and (x0, y0) is the point (0, 0).
To compute the area for a curve from a test data set or from cross-validated data, use the points from the corresponding curve.
Notation
| Term | Description |
|---|---|
| TPR | true positive rate |
| FPR | false positive rate |
| TP | true positive, events that were correctly assessed |
| FN | false negative, events that were incorrectly assessed |
| P | number of actual positive events |
| FP | false positive, nonevents that were incorrectly assessed |
| N | number of actual negative events |
| FNR | false negative rate |
| TNR | true negative rate |
Example
| x (false positive rate) | y (true positive rate) |
|---|---|
| 0.0923 | 0.3051 |
| 0.4154 | 0.7288 |
| 0.7538 | 0.9322 |
| 1 | 1 |


95% CI for the area under the ROC curve
The following interval gives the upper and lower bounds for the confidence interval:

The computation of the standard error of the area under the ROC curve
( )
comes from Salford Predictive Modeler®. For general information
about estimation of the variance of the area under the ROC curve, see the
following references:
)
comes from Salford Predictive Modeler®. For general information
about estimation of the variance of the area under the ROC curve, see the
following references:
Engelmann, B. (2011). Measures of a ratings discriminative power: Applications and limitations. In B. Engelmann & R. Rauhmeier (Eds.), The Basel II Risk Parameters: Estimation, Validation, Stress Testing - With Applications to Loan Risk Management (2nd ed.) Heidelberg; New York: Springer. doi:10.1007/978-3-642-16114-8
Cortes, C. and Mohri, M. (2005). Confidence intervals for the area under the ROC curve. Advances in neural information processing systems, 305-312.
Feng, D., Cortese, G., & Baumgartner, R. (2017). A comparison of confidence/credible interval methods for the area under the ROC curve for continuous diagnostic tests with small sample size. Statistical Methods in Medical Research, 26(6), 2603-2621. doi:10.1177/0962280215602040
Notation
| Term | Description |
|---|---|
| A | area under the ROC curve |
 | 0.975 percentile of the standard normal distribution |
Lift
To see general calculations for cumulative lift, go to Methods and formulas for the lift chart for Fit Model and Discover Key Predictors with TreeNet® Classification.
Misclassification rate
In the weighted case, use weighted counts in place of counts.

For k-fold cross-validation, the misclassed count is the sum of the misclassifications from when each fold is the test data set.
For validation with a test data set, the misclassed count is the sum of misclassifications in the test data set and the total count is for the test data set.