Note
This command is available with the Predictive Analytics Module. Click here for more information about how to activate the module.
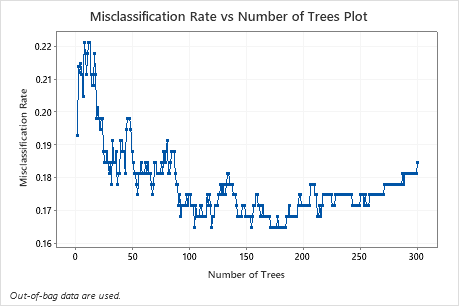
The Misclassification Rate vs Number of Trees Plot plots the misclassification rate on the y-axis and the number of trees on the x-axis for the out-of-bag data. Each tree in the forest casts a vote for the classification for a row.
Interpretation
The misclassification rates must be ≥ 0. Lower values indicate a better classification model. If you use a test set in addition to the out-of-bag data method, Minitab displays a curve for each validation method.